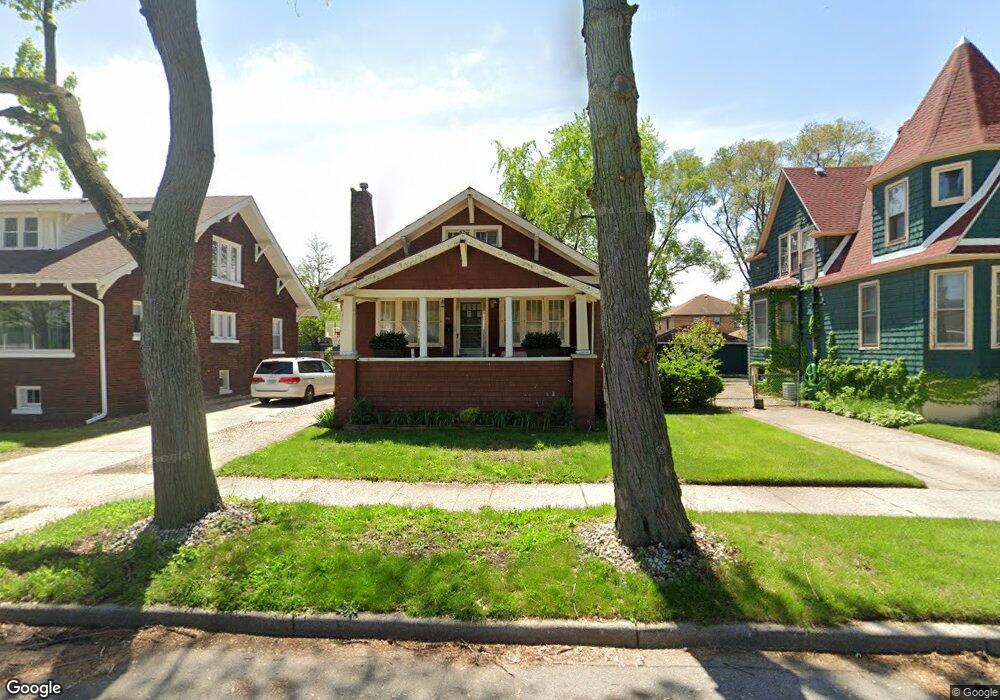
34 Condit St Hammond, IN 46320
Estimated Value: $151,854 - $253,000
3
Beds
1
Bath
2,820
Sq Ft
$70/Sq Ft
Est. Value
About This Home
This home is located at 34 Condit St, Hammond, IN 46320 and is currently estimated at $196,964, approximately $69 per square foot. 34 Condit St is a home located in Lake County with nearby schools including Lew Wallace Elementary School, Eggers Middle School, and Hammond High School.
Ownership History
Date
Name
Owned For
Owner Type
Purchase Details
Closed on
Oct 25, 2017
Sold by
Diverse Real Estate Investments Llc
Bought by
Colonial Impact Fund Ii Llc
Current Estimated Value
Purchase Details
Closed on
Oct 14, 2016
Sold by
Diverse Real Estate Investments Llc
Bought by
Mazon Lizeth Abigail Medina and Mazon Luz Daniel
Purchase Details
Closed on
Sep 23, 2016
Sold by
Barnbart Kathy
Bought by
Diverse Real Estate Investments Llc
Purchase Details
Closed on
Aug 11, 2015
Sold by
Ruckman Jeffrey and Barnhart Kathy
Bought by
Barnhart Kathy
Purchase Details
Closed on
Apr 2, 2009
Sold by
Ruckman Jeffery and Estate Of Katherine E Ruckman
Bought by
Ruckman Jeffery and Barnhart Kathy
Create a Home Valuation Report for This Property
The Home Valuation Report is an in-depth analysis detailing your home's value as well as a comparison with similar homes in the area
Home Values in the Area
Average Home Value in this Area
Purchase History
| Date | Buyer | Sale Price | Title Company |
|---|---|---|---|
| Colonial Impact Fund Ii Llc | $27,700 | None Available | |
| Mazon Lizeth Abigail Medina | -- | None Available | |
| Diverse Real Estate Investments Llc | $5,500 | None Available | |
| Barnhart Kathy | -- | Attorney | |
| Ruckman Jeffery | -- | None Available |
Source: Public Records
Tax History
| Year | Tax Paid | Tax Assessment Tax Assessment Total Assessment is a certain percentage of the fair market value that is determined by local assessors to be the total taxable value of land and additions on the property. | Land | Improvement |
|---|---|---|---|---|
| 2025 | $2,725 | $126,100 | $21,600 | $104,500 |
| 2024 | $4,593 | $113,500 | $21,600 | $91,900 |
| 2023 | $2,455 | $96,100 | $22,500 | $73,600 |
| 2022 | $2,455 | $91,600 | $22,500 | $69,100 |
| 2021 | $2,084 | $76,900 | $11,200 | $65,700 |
| 2020 | $1,987 | $72,800 | $11,200 | $61,600 |
| 2019 | $1,952 | $67,200 | $13,100 | $54,100 |
| 2018 | $1,959 | $62,000 | $13,100 | $48,900 |
| 2017 | $2,147 | $59,300 | $13,100 | $46,200 |
| 2016 | $1,825 | $58,300 | $13,100 | $45,200 |
| 2014 | $1,880 | $60,000 | $13,100 | $46,900 |
| 2013 | $1,889 | $63,700 | $13,100 | $50,600 |
Source: Public Records
Map
Nearby Homes
Your Personal Tour Guide
Ask me questions while you tour the home.