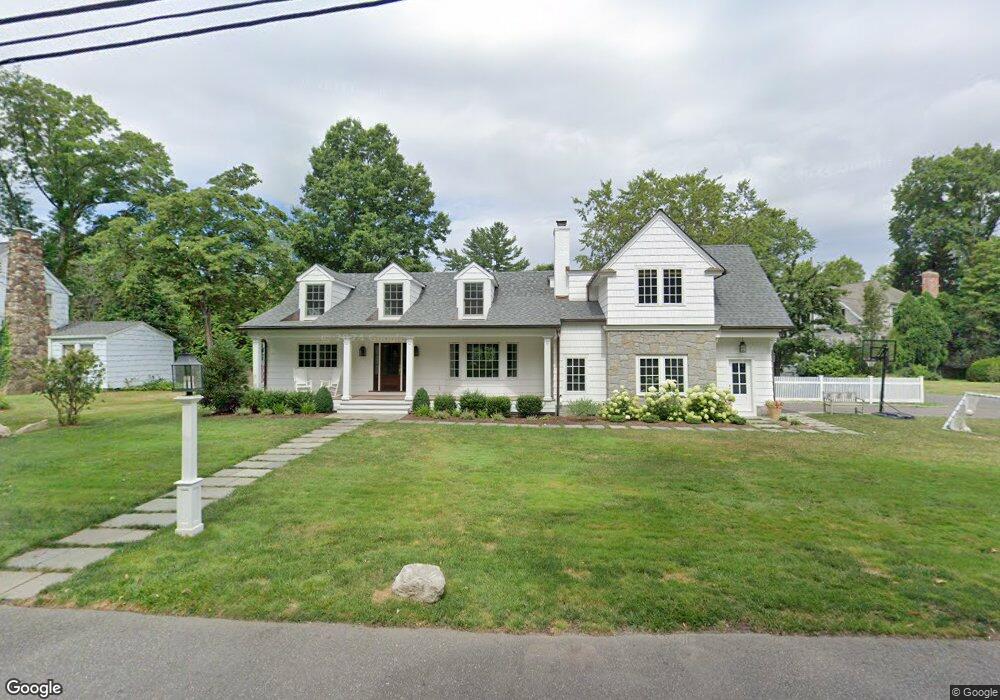
34 Druid Ln Riverside, CT 06878
Estimated Value: $1,968,000 - $3,282,724
5
Beds
3
Baths
2,201
Sq Ft
$1,300/Sq Ft
Est. Value
About This Home
This home is located at 34 Druid Ln, Riverside, CT 06878 and is currently estimated at $2,860,681, approximately $1,299 per square foot. 34 Druid Ln is a home located in Fairfield County with nearby schools including Riverside School, Eastern Middle School, and Greenwich High School.
Ownership History
Date
Name
Owned For
Owner Type
Purchase Details
Closed on
Jun 7, 2016
Sold by
Campinell Joseph and Campinell Mary
Bought by
Campinell Mark and Campinell Lacey
Current Estimated Value
Home Financials for this Owner
Home Financials are based on the most recent Mortgage that was taken out on this home.
Original Mortgage
$1,020,000
Interest Rate
3.59%
Mortgage Type
Purchase Money Mortgage
Purchase Details
Closed on
Jul 1, 2003
Sold by
Frey Brian S and Frey Melissa C
Bought by
Campinell Joseph and Campinell Mary
Home Financials for this Owner
Home Financials are based on the most recent Mortgage that was taken out on this home.
Original Mortgage
$650,000
Interest Rate
4.87%
Purchase Details
Closed on
Dec 14, 1998
Sold by
Tanikawa Yoshio and Tanokawa Noriko
Bought by
Frey Brian S and Frey Melissa C
Purchase Details
Closed on
Dec 16, 1996
Sold by
Shiiba Hiroshi
Bought by
Tanikawa Yoshio
Create a Home Valuation Report for This Property
The Home Valuation Report is an in-depth analysis detailing your home's value as well as a comparison with similar homes in the area
Home Values in the Area
Average Home Value in this Area
Purchase History
| Date | Buyer | Sale Price | Title Company |
|---|---|---|---|
| Campinell Mark | $1,275,000 | -- | |
| Campinell Joseph | $1,150,000 | -- | |
| Frey Brian S | $620,000 | -- | |
| Tanikawa Yoshio | $550,000 | -- |
Source: Public Records
Mortgage History
| Date | Status | Borrower | Loan Amount |
|---|---|---|---|
| Closed | Campinell Mark | $1,020,000 | |
| Previous Owner | Tanikawa Yoshio | $650,000 | |
| Previous Owner | Tanikawa Yoshio | $650,000 | |
| Previous Owner | Tanikawa Yoshio | $500,000 |
Source: Public Records
Tax History
| Year | Tax Paid | Tax Assessment Tax Assessment Total Assessment is a certain percentage of the fair market value that is determined by local assessors to be the total taxable value of land and additions on the property. | Land | Improvement |
|---|---|---|---|---|
| 2025 | $17,692 | $1,431,500 | $978,250 | $453,250 |
| 2024 | $17,086 | $1,431,500 | $978,250 | $453,250 |
| 2023 | $14,906 | $1,281,000 | $978,250 | $302,750 |
| 2022 | $13,797 | $1,196,580 | $978,250 | $218,330 |
| 2021 | $13,542 | $1,124,760 | $903,000 | $221,760 |
| 2020 | $13,165 | $1,095,220 | $903,000 | $192,220 |
| 2019 | $13,296 | $1,095,220 | $903,000 | $192,220 |
| 2018 | $13,000 | $1,095,220 | $903,000 | $192,220 |
| 2017 | $13,163 | $1,095,220 | $903,000 | $192,220 |
| 2016 | $12,809 | $1,082,830 | $903,000 | $179,830 |
| 2015 | $11,256 | $943,880 | $767,480 | $176,400 |
| 2014 | $10,973 | $943,880 | $767,480 | $176,400 |
Source: Public Records
Map
Nearby Homes
- 1 Bramble Ln
- 14 Bradbury Place
- 25 Dialstone Ln
- 32 Meyer Place
- 56 Winthrop Dr
- 47 Owenoke Way
- 10 Verona Dr
- 10 Lockwood Rd
- 29 Sound Beach Ave
- 16 Summit Rd
- 20 Sound Beach Ave
- 247 Riverside Ave
- 21 Lake Dr
- 23 Westview Place
- 2 Potter Dr
- 2 Forest Ave
- 11 Field Rd
- 23 Thornhill Rd
- 115 River Rd Unit 7
- 7 Indian Head Rd
Your Personal Tour Guide
Ask me questions while you tour the home.