Estimated Value: $272,000 - $429,000
Studio
--
Bath
1,728
Sq Ft
$197/Sq Ft
Est. Value
About This Home
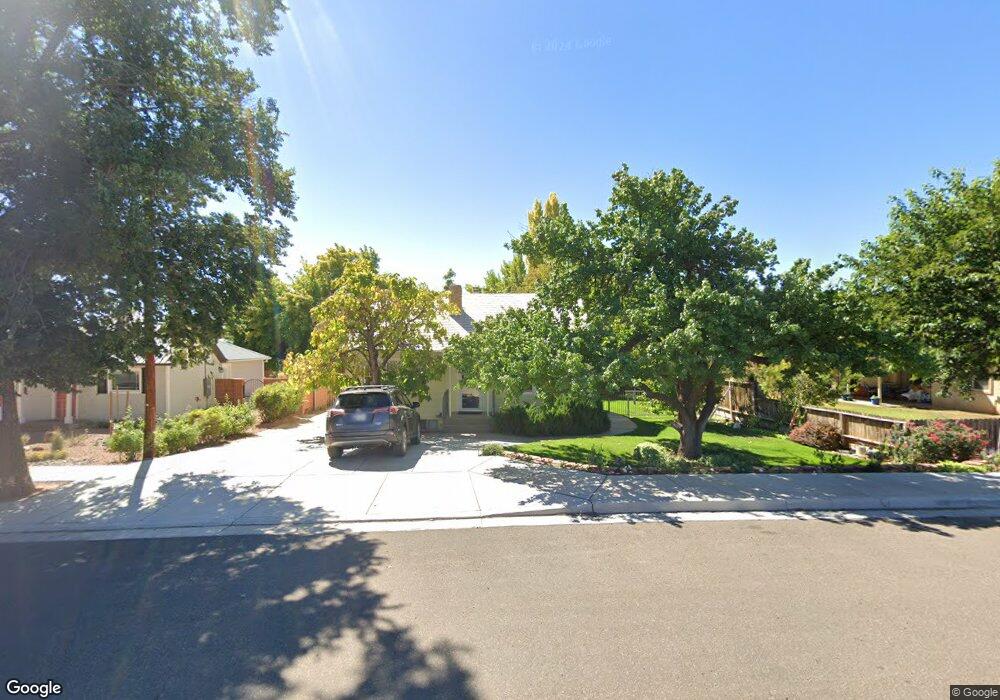
This home is located at 34 E 300 S, Kanab, UT 84741 and is currently estimated at $340,548, approximately $197 per square foot. 34 E 300 S is a home located in Kane County with nearby schools including Kanab Elementary School, Kanab Middle School, and Kanab High School.
Ownership History
Date
Name
Owned For
Owner Type
Purchase Details
Closed on
Aug 3, 2015
Sold by
Gailmarie West
Bought by
Michl Carol and Dearborn Shawna Michl
Current Estimated Value
Purchase Details
Closed on
May 27, 2008
Sold by
Mich'L Carol
Bought by
Mich'L Carol and Dearborn Shawna Mich'L
Create a Home Valuation Report for This Property
The Home Valuation Report is an in-depth analysis detailing your home's value as well as a comparison with similar homes in the area
Home Values in the Area
Average Home Value in this Area
Purchase History
| Date | Buyer | Sale Price | Title Company |
|---|---|---|---|
| Michl Carol | -- | -- | |
| Mich'L Carol | -- | -- |
Source: Public Records
Tax History
| Year | Tax Paid | Tax Assessment Tax Assessment Total Assessment is a certain percentage of the fair market value that is determined by local assessors to be the total taxable value of land and additions on the property. | Land | Improvement |
|---|---|---|---|---|
| 2025 | $1,984 | $231,270 | $137,621 | $93,649 |
| 2024 | $1,882 | $120,278 | $61,243 | $59,035 |
| 2023 | $1,710 | $111,995 | $58,327 | $53,668 |
| 2022 | $1,502 | $97,395 | $48,606 | $48,789 |
| 2021 | $1,374 | $133,689 | $67,980 | $65,709 |
| 2020 | $1,322 | $124,939 | $61,800 | $63,139 |
| 2019 | $1,520 | $139,900 | $54,780 | $85,120 |
| 2018 | $1,434 | $130,770 | $45,650 | $85,120 |
| 2017 | $1,371 | $119,434 | $41,500 | $77,934 |
| 2016 | $1,250 | $105,751 | $41,500 | $64,251 |
| 2015 | $1,046 | $96,884 | $37,500 | $59,384 |
| 2014 | $1,046 | $88,023 | $39,803 | $48,220 |
| 2013 | -- | $88,023 | $0 | $0 |
Source: Public Records
Map
Nearby Homes
- 325 S Main St
- 176 S 100 E
- 476 S 100 E
- 300 S 300 E Unit A5
- 141 W 100 S
- 611 S 175 E
- 1117 S Terrel Dr
- 235 W 100 S
- 380 E 200 S
- 80 E Red Shadow Cir
- 0 100 Unit 1409231
- 818 S Highway 89a
- 70 N Main St
- 275 E 650 S Unit 5
- 35 N 100 W
- 528 S 410 E
- 2550 S
- 442 E 100 S
- 442 100 South - Casita
- 425 W Momori Cir Unit A-6
Your Personal Tour Guide
Ask me questions while you tour the home.