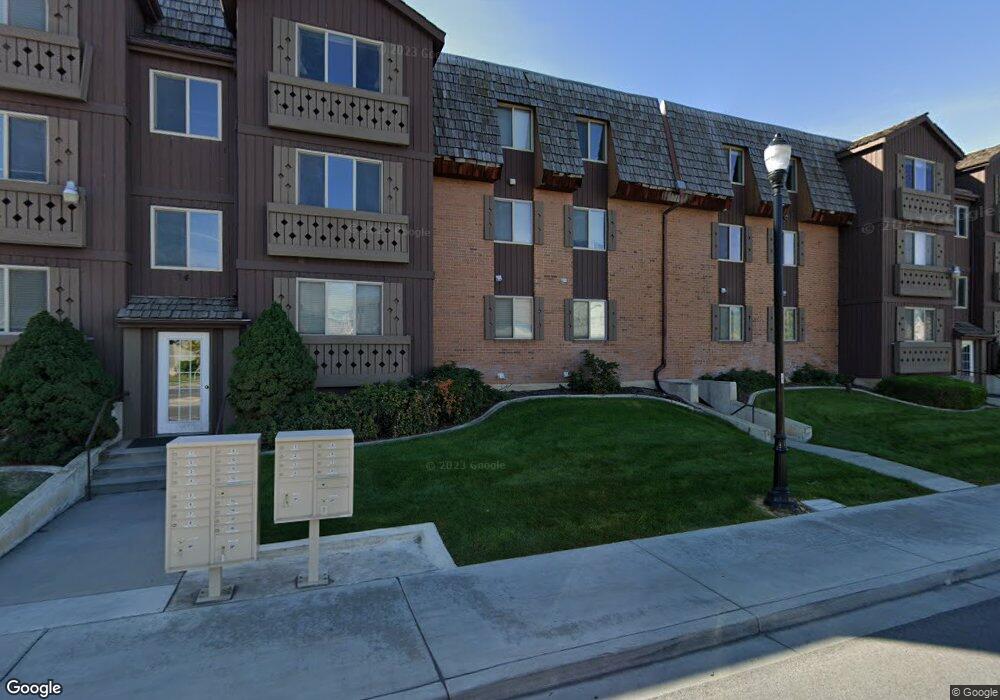
34 E 700 N Provo, UT 84606
Joaquin NeighborhoodEstimated Value: $353,528 - $385,000
2
Beds
2
Baths
1,091
Sq Ft
$340/Sq Ft
Est. Value
About This Home
This home is located at 34 E 700 N, Provo, UT 84606 and is currently estimated at $371,176, approximately $340 per square foot. 34 E 700 N is a home located in Utah County with nearby schools including Provo Peaks School, Centennial Middle School, and Timpview High School.
Ownership History
Date
Name
Owned For
Owner Type
Purchase Details
Closed on
Nov 11, 2021
Sold by
Lori Lyn Regas Tucker Trust and Lori Lyn Regas Tucker Trust
Bought by
Lori Lyn Regas Trust and Lori Lyn Rogas Trust
Current Estimated Value
Purchase Details
Closed on
Jul 18, 2016
Sold by
Marsh Lori R
Bought by
Regas Lori Lynn
Purchase Details
Closed on
Jul 14, 2016
Sold by
Marsh Steven P
Bought by
Marsh Lori R
Purchase Details
Closed on
Feb 4, 1998
Sold by
Streets Rod B
Bought by
Beutler Kevin L and Beutler Deanne C
Home Financials for this Owner
Home Financials are based on the most recent Mortgage that was taken out on this home.
Original Mortgage
$95,300
Interest Rate
6.95%
Mortgage Type
Balloon
Purchase Details
Closed on
Apr 2, 1997
Sold by
Jurgens James E and Jurgens Rona M
Bought by
Streets Rod B
Create a Home Valuation Report for This Property
The Home Valuation Report is an in-depth analysis detailing your home's value as well as a comparison with similar homes in the area
Home Values in the Area
Average Home Value in this Area
Purchase History
| Date | Buyer | Sale Price | Title Company |
|---|---|---|---|
| Lori Lyn Regas Trust | -- | None Listed On Document | |
| Regas Lori Lynn | -- | None Available | |
| Marsh Lori R | -- | None Available | |
| Beutler Kevin L | -- | Equity Title Agency Inc | |
| Streets Rod B | -- | -- |
Source: Public Records
Mortgage History
| Date | Status | Borrower | Loan Amount |
|---|---|---|---|
| Previous Owner | Beutler Kevin L | $95,300 |
Source: Public Records
Tax History
| Year | Tax Paid | Tax Assessment Tax Assessment Total Assessment is a certain percentage of the fair market value that is determined by local assessors to be the total taxable value of land and additions on the property. | Land | Improvement |
|---|---|---|---|---|
| 2025 | $1,898 | $181,720 | -- | -- |
| 2024 | $1,898 | $186,835 | $0 | $0 |
| 2023 | $2,027 | $196,680 | $0 | $0 |
| 2022 | $2,141 | $209,495 | $0 | $0 |
| 2021 | $1,800 | $307,200 | $36,900 | $270,300 |
| 2020 | $1,775 | $284,000 | $34,100 | $249,900 |
| 2019 | $1,545 | $257,000 | $29,000 | $228,000 |
| 2018 | $1,410 | $238,000 | $29,000 | $209,000 |
| 2017 | $1,266 | $117,370 | $0 | $0 |
| 2016 | $1,235 | $106,700 | $0 | $0 |
| 2015 | $1,133 | $99,000 | $0 | $0 |
| 2014 | $966 | $88,000 | $0 | $0 |
Source: Public Records
Map
Nearby Homes
Your Personal Tour Guide
Ask me questions while you tour the home.