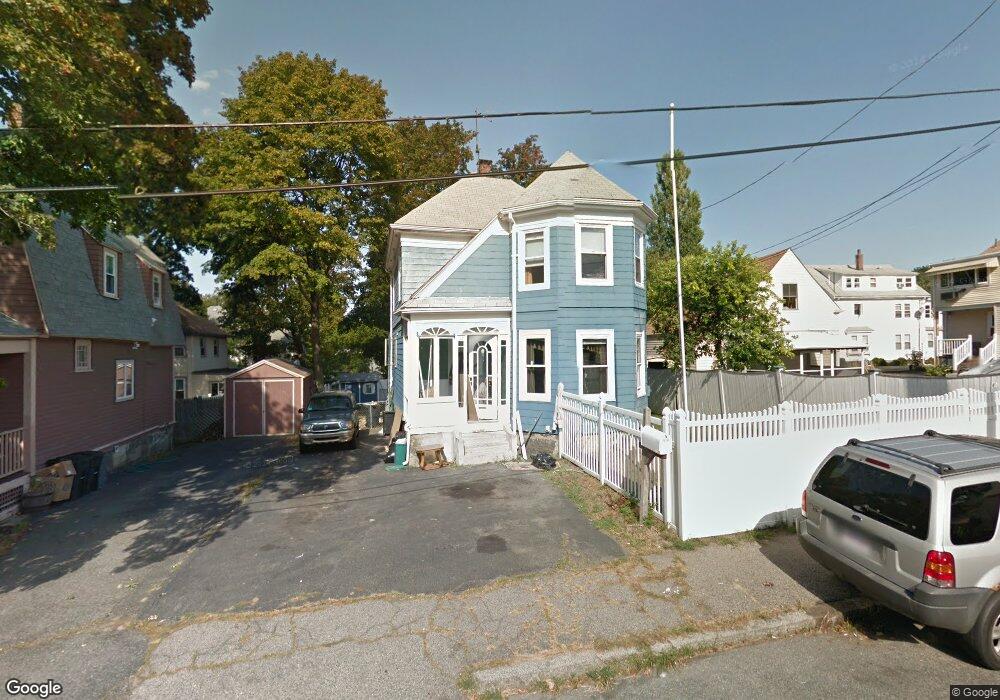
34 Farnum St Quincy, MA 02169
Quincy Point NeighborhoodEstimated Value: $566,000 - $681,000
3
Beds
2
Baths
1,272
Sq Ft
$501/Sq Ft
Est. Value
About This Home
This home is located at 34 Farnum St, Quincy, MA 02169 and is currently estimated at $637,813, approximately $501 per square foot. 34 Farnum St is a home located in Norfolk County with nearby schools including Point Webster Middle School, Clifford H. Marshall Elementary School, and Quincy High School.
Ownership History
Date
Name
Owned For
Owner Type
Purchase Details
Closed on
Jun 9, 1997
Sold by
Nangle Richard K
Bought by
Holland Edward P and Holland Karen M
Current Estimated Value
Home Financials for this Owner
Home Financials are based on the most recent Mortgage that was taken out on this home.
Original Mortgage
$145,350
Interest Rate
7.98%
Mortgage Type
Purchase Money Mortgage
Create a Home Valuation Report for This Property
The Home Valuation Report is an in-depth analysis detailing your home's value as well as a comparison with similar homes in the area
Home Values in the Area
Average Home Value in this Area
Purchase History
| Date | Buyer | Sale Price | Title Company |
|---|---|---|---|
| Holland Edward P | $126,000 | -- |
Source: Public Records
Mortgage History
| Date | Status | Borrower | Loan Amount |
|---|---|---|---|
| Open | Holland Edward P | $240,000 | |
| Closed | Holland Edward P | $163,500 | |
| Closed | Holland Edward P | $145,350 | |
| Previous Owner | Holland Edward P | $102,100 |
Source: Public Records
Tax History Compared to Growth
Tax History
| Year | Tax Paid | Tax Assessment Tax Assessment Total Assessment is a certain percentage of the fair market value that is determined by local assessors to be the total taxable value of land and additions on the property. | Land | Improvement |
|---|---|---|---|---|
| 2025 | $5,914 | $512,900 | $260,200 | $252,700 |
| 2024 | $5,531 | $490,800 | $247,900 | $242,900 |
| 2023 | $5,065 | $455,100 | $225,300 | $229,800 |
| 2022 | $5,063 | $422,600 | $204,900 | $217,700 |
| 2021 | $4,821 | $397,100 | $204,900 | $192,200 |
| 2020 | $4,612 | $371,000 | $193,200 | $177,800 |
| 2019 | $4,446 | $354,300 | $178,900 | $175,400 |
| 2018 | $4,266 | $319,800 | $162,600 | $157,200 |
| 2017 | $4,257 | $300,400 | $154,900 | $145,500 |
| 2016 | $3,963 | $276,000 | $140,800 | $135,200 |
| 2015 | $3,741 | $256,200 | $132,800 | $123,400 |
| 2014 | $3,581 | $241,000 | $132,800 | $108,200 |
Source: Public Records
Map
Nearby Homes
- 16 Perley Place
- 161 Sumner St Unit 2
- 161 Sumner St Unit 4
- 200 Cove Way Unit 614
- 313 Washington St
- 25 5th Ave
- 934 Southern Artery Unit 109
- 41 Broadway
- 585 Washington St Unit model-1
- 585 Washington St Unit model-2
- 585 Washington St Unit model
- 19 Keyes St
- 51 Sumner St
- 32 Sumner St
- 16 Dartmouth St Unit 16
- 26 Lawrence St
- 187 Washington St
- 62 Lawn Ave
- 66 Mcgrath Hwy Unit 407
- 66 Mcgrath Hwy Unit 405
- 30 Farnum St
- 25 Thompson St
- 49 Bay View St
- 52 River St
- 52 River St Unit 2
- 59 Bay View St
- 11 Thompson St
- 29 Thompson St
- 61 Bay View St
- 61 Bay View St Unit 2
- 61 Bay View St Unit 1
- 58 River St
- 58 River St Unit 2
- 20 Farnum St
- 20 Farnum St Unit 1
- 7 Thompson St
- 40 River St Unit 1
- 40 River St
- 64 River St
- 28 Thompson St