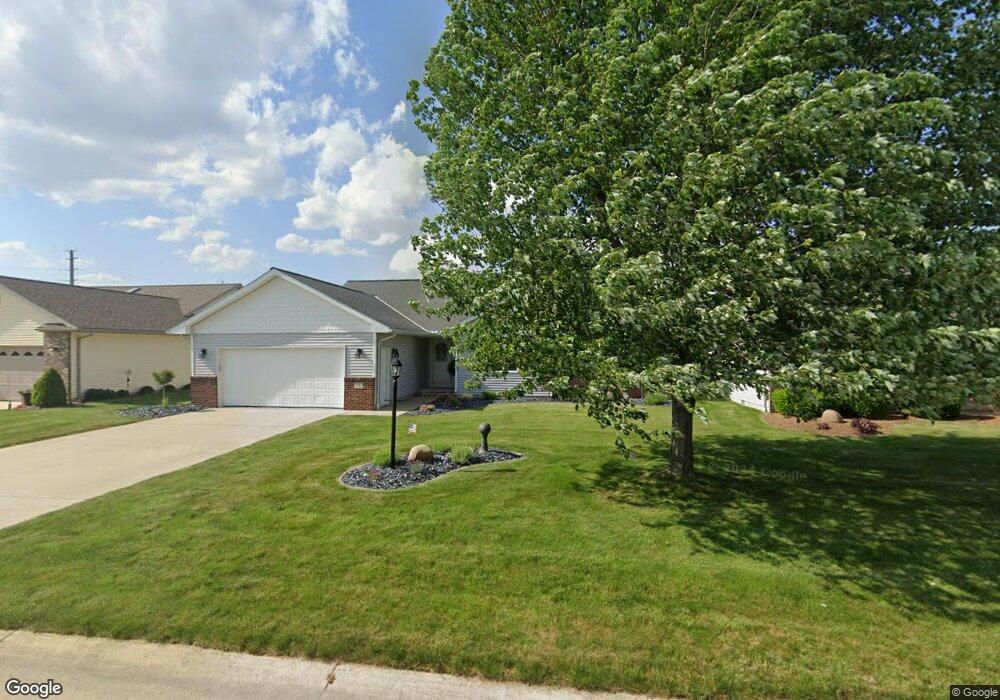
34 Fox Run Dr Unit 34 Fremont, OH 43420
Estimated Value: $257,409 - $270,000
3
Beds
2
Baths
1,701
Sq Ft
$154/Sq Ft
Est. Value
About This Home
This home is located at 34 Fox Run Dr Unit 34, Fremont, OH 43420 and is currently estimated at $261,852, approximately $153 per square foot. 34 Fox Run Dr Unit 34 is a home located in Sandusky County with nearby schools including Fremont Ross High School, Bishop Hoffman Catholic School - This is St Joe's School now, and St. Joseph School.
Ownership History
Date
Name
Owned For
Owner Type
Purchase Details
Closed on
Aug 19, 2022
Sold by
Mehling Kenneth W and Mehling Diane L
Bought by
Durnwald Michael P and Durnwald Barbara J
Current Estimated Value
Purchase Details
Closed on
Jul 16, 2020
Sold by
Byerly Evelyn A and Thomas L Dalton Living Trust
Bought by
Mehling Kenneth W and Mehling Diane L
Purchase Details
Closed on
Sep 28, 2015
Sold by
Brock Jeannette M
Bought by
Dalton Thomas L and Dalton Living Trust
Purchase Details
Closed on
Sep 12, 2006
Sold by
Salyer Mark E and Salyer Lynn M
Bought by
Brock Jeannette M
Purchase Details
Closed on
Mar 18, 2003
Sold by
Gabel Construction Co
Bought by
Salyer Mark E and Salyer Lynn M
Home Financials for this Owner
Home Financials are based on the most recent Mortgage that was taken out on this home.
Original Mortgage
$119,040
Interest Rate
6.94%
Mortgage Type
Purchase Money Mortgage
Create a Home Valuation Report for This Property
The Home Valuation Report is an in-depth analysis detailing your home's value as well as a comparison with similar homes in the area
Home Values in the Area
Average Home Value in this Area
Purchase History
| Date | Buyer | Sale Price | Title Company |
|---|---|---|---|
| Durnwald Michael P | -- | -- | |
| Durnwald Michael P | -- | First American Title | |
| Mehling Kenneth W | $165,000 | First American Title | |
| Dalton Thomas L | $140,000 | Attorney | |
| Brock Jeannette M | $111,375 | First American Title | |
| Salyer Mark E | $111,600 | Culbert Title Agency |
Source: Public Records
Mortgage History
| Date | Status | Borrower | Loan Amount |
|---|---|---|---|
| Previous Owner | Salyer Mark E | $119,040 |
Source: Public Records
Tax History Compared to Growth
Tax History
| Year | Tax Paid | Tax Assessment Tax Assessment Total Assessment is a certain percentage of the fair market value that is determined by local assessors to be the total taxable value of land and additions on the property. | Land | Improvement |
|---|---|---|---|---|
| 2024 | $2,230 | $57,370 | $9,210 | $48,160 |
| 2023 | $2,230 | $53,730 | $8,750 | $44,980 |
| 2022 | $1,867 | $53,730 | $8,750 | $44,980 |
| 2021 | $1,924 | $53,730 | $8,750 | $44,980 |
| 2020 | $2,207 | $49,460 | $8,750 | $40,710 |
| 2019 | $1,774 | $49,460 | $8,750 | $40,710 |
| 2018 | $1,726 | $49,460 | $8,750 | $40,710 |
| 2017 | $1,486 | $43,610 | $8,750 | $34,860 |
| 2016 | $1,302 | $43,610 | $8,750 | $34,860 |
| 2015 | $1,281 | $43,610 | $8,750 | $34,860 |
| 2014 | $1,206 | $40,190 | $8,930 | $31,260 |
| 2013 | $1,181 | $40,190 | $8,930 | $31,260 |
Source: Public Records
Map
Nearby Homes
- 10 Meadowbrook Dr
- 10 Meadowbrook Ln
- 1420 Center St
- 64 River Run Dr Unit J
- 350 Conner Dr
- 1818 Finley Dr
- 135 Briarwood Cir
- 1970 Morrison Rd
- 1832 Myrtle St
- 2484 Buckland Ave
- 1719 Buckland Ave
- 1485 Autumn Woods Dr
- 1013 Whittlesey St
- 905 Twinn St
- 933 E Cole Rd
- 18 Katlyn Dr
- 1028 June St
- 625 Bush Place
- 815 South St
- 1611 Mcpherson Blvd
- 34 Creek 649
- 38 Fox Run Dr Unit 38
- 26 Fox Run Dr Unit 26
- 35 Fox Run Dr Unit 35
- 42 Fox Run Dr Unit 42
- 31 Fox Run Dr Unit 43
- 39 Fox Run Dr Unit 39
- 31 Creek 649
- 43 Fox Run Dr
- 27 Fox Run Dr
- 46 Fox Run Dr Unit 46
- 43 Creek 649
- 46 Creek 649
- 23 Fox Run Dr
- 23 Creek 649
- 47 Fox Run Dr
- 18 Fox Run Dr Unit 18
- 50 Fox Run Dr Unit 50
- 1609 W Cole Rd
- 51 Fox Run Dr