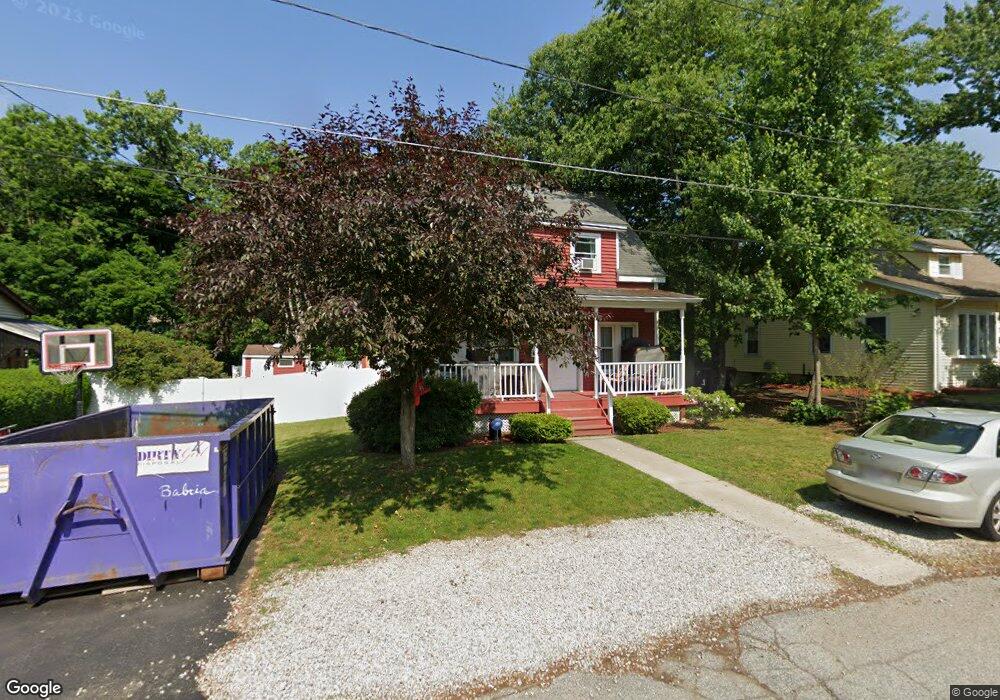
34 Franklin St Auburn, MA 01501
Stoneville NeighborhoodEstimated Value: $372,000 - $414,000
3
Beds
2
Baths
936
Sq Ft
$419/Sq Ft
Est. Value
About This Home
This home is located at 34 Franklin St, Auburn, MA 01501 and is currently estimated at $392,058, approximately $418 per square foot. 34 Franklin St is a home located in Worcester County with nearby schools including Auburn Senior High School, Canterbury Street School, and Shrewsbury Montessori School - Auburn Campus.
Ownership History
Date
Name
Owned For
Owner Type
Purchase Details
Closed on
May 5, 2011
Sold by
Goduto Elizabeth M
Bought by
Goduto Elizabeth M and Crossman Anthony G
Current Estimated Value
Home Financials for this Owner
Home Financials are based on the most recent Mortgage that was taken out on this home.
Original Mortgage
$161,196
Outstanding Balance
$105,597
Interest Rate
3.75%
Mortgage Type
FHA
Estimated Equity
$286,461
Purchase Details
Closed on
Apr 19, 2011
Sold by
Bing Colleen M
Bought by
Goduto Elizabeth M
Home Financials for this Owner
Home Financials are based on the most recent Mortgage that was taken out on this home.
Original Mortgage
$161,196
Outstanding Balance
$105,597
Interest Rate
3.75%
Mortgage Type
FHA
Estimated Equity
$286,461
Purchase Details
Closed on
May 29, 1997
Sold by
Martin Matthew L
Bought by
Bing Walter G and Bing Colleen M
Purchase Details
Closed on
Jul 30, 1991
Sold by
Langille Jessie
Bought by
Martin Matthew and Anne Lavallee
Create a Home Valuation Report for This Property
The Home Valuation Report is an in-depth analysis detailing your home's value as well as a comparison with similar homes in the area
Home Values in the Area
Average Home Value in this Area
Purchase History
| Date | Buyer | Sale Price | Title Company |
|---|---|---|---|
| Goduto Elizabeth M | -- | -- | |
| Goduto Elizabeth M | $165,480 | -- | |
| Bing Walter G | $99,900 | -- | |
| Martin Matthew | $64,000 | -- |
Source: Public Records
Mortgage History
| Date | Status | Borrower | Loan Amount |
|---|---|---|---|
| Open | Goduto Elizabeth M | $161,196 | |
| Previous Owner | Martin Matthew | $115,000 | |
| Previous Owner | Martin Matthew | $20,000 | |
| Previous Owner | Martin Matthew | $101,000 |
Source: Public Records
Tax History
| Year | Tax Paid | Tax Assessment Tax Assessment Total Assessment is a certain percentage of the fair market value that is determined by local assessors to be the total taxable value of land and additions on the property. | Land | Improvement |
|---|---|---|---|---|
| 2025 | $4,924 | $344,600 | $114,200 | $230,400 |
| 2024 | $4,652 | $311,600 | $108,500 | $203,100 |
| 2023 | $4,585 | $288,700 | $98,600 | $190,100 |
| 2022 | $4,329 | $257,400 | $98,600 | $158,800 |
| 2021 | $5,659 | $219,300 | $87,000 | $132,300 |
| 2020 | $3,857 | $214,500 | $87,000 | $127,500 |
| 2019 | $3,653 | $198,300 | $86,100 | $112,200 |
| 2018 | $4,531 | $182,800 | $80,500 | $102,300 |
| 2017 | $3,129 | $170,600 | $73,000 | $97,600 |
| 2016 | $3,034 | $167,700 | $76,800 | $90,900 |
| 2015 | $2,805 | $162,500 | $76,800 | $85,700 |
| 2014 | $2,758 | $159,500 | $73,100 | $86,400 |
Source: Public Records
Map
Nearby Homes
- 5 Commonwealth Ave
- 99 Clover St
- 177 Boyce St
- 25 Vinal St Unit 28
- 25 Vinal St Unit 26
- 25 Vinal St Unit 29
- 25 Vinal St Unit 30
- 1 Rockland Road Ct
- 204-212 Hampton St
- 177 Oxford St N
- 154 Pakachoag St
- 1034 Southbridge St
- 31-33 Walsh Ave
- 33 Walsh Ave
- 31 Walsh Ave
- 11 Hulbert Rd Unit 13
- 40 Bryn Mawr Ave
- 47 Malvern Rd
- 19-20 Williams St
- 33 Eastford Rd
- 32 Franklin St
- 36 Franklin St
- 30 Franklin St
- 87 Boyce St
- 85 Boyce St
- 85 Boyce St Unit 2
- 85 Boyce St Unit 1
- 5 Sword St
- 89 Boyce St
- 83 Boyce St
- 35 Franklin St
- 71 Boyce St
- 29 Franklin St
- 11 Sword St Unit 2R
- 11 Sword St Unit 2L
- 11 Sword St Unit 1R
- 11 Sword St Unit 1L
- 25 Franklin St
- 93 Boyce St
- 86 Boyce St
Your Personal Tour Guide
Ask me questions while you tour the home.