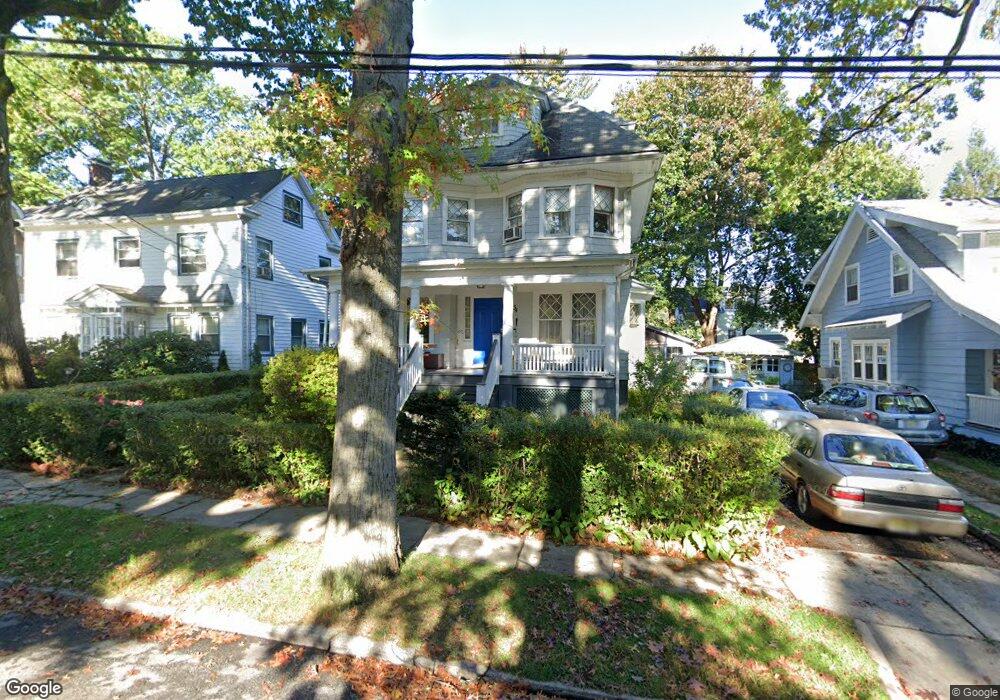
34 Fulton St Bloomfield, NJ 07003
Estimated Value: $557,000 - $633,000
Studio
--
Bath
1,972
Sq Ft
$305/Sq Ft
Est. Value
About This Home
This home is located at 34 Fulton St, Bloomfield, NJ 07003 and is currently estimated at $600,661, approximately $304 per square foot. 34 Fulton St is a home located in Essex County with nearby schools including Watsessing Elementary School, Bloomfield Middle School, and Bloomfield High School.
Ownership History
Date
Name
Owned For
Owner Type
Purchase Details
Closed on
Sep 8, 1998
Sold by
Wilshire Funding
Bought by
Chin Joseph and George Brenda
Current Estimated Value
Home Financials for this Owner
Home Financials are based on the most recent Mortgage that was taken out on this home.
Original Mortgage
$92,000
Outstanding Balance
$19,652
Interest Rate
6.9%
Mortgage Type
FHA
Estimated Equity
$581,009
Purchase Details
Closed on
May 23, 1989
Sold by
Bettelli Margaret
Bought by
Abdel-Messeh Nabil M and Abdel-Messeh Magda
Create a Home Valuation Report for This Property
The Home Valuation Report is an in-depth analysis detailing your home's value as well as a comparison with similar homes in the area
Home Values in the Area
Average Home Value in this Area
Purchase History
| Date | Buyer | Sale Price | Title Company |
|---|---|---|---|
| Chin Joseph | $3,008,360 | -- | |
| Abdel-Messeh Nabil M | $135,500 | -- |
Source: Public Records
Mortgage History
| Date | Status | Borrower | Loan Amount |
|---|---|---|---|
| Open | Chin Joseph | $92,000 |
Source: Public Records
Tax History
| Year | Tax Paid | Tax Assessment Tax Assessment Total Assessment is a certain percentage of the fair market value that is determined by local assessors to be the total taxable value of land and additions on the property. | Land | Improvement |
|---|---|---|---|---|
| 2025 | $10,420 | $307,200 | $142,700 | $164,500 |
| 2024 | $10,039 | $307,200 | $142,700 | $164,500 |
| 2022 | $9,837 | $307,200 | $142,700 | $164,500 |
| 2021 | $9,655 | $307,200 | $142,700 | $164,500 |
| 2020 | $9,508 | $307,200 | $142,700 | $164,500 |
| 2019 | $10,510 | $264,000 | $127,000 | $137,000 |
| 2018 | $10,465 | $264,000 | $127,000 | $137,000 |
| 2017 | $10,307 | $264,000 | $127,000 | $137,000 |
| 2016 | $11,117 | $288,000 | $127,000 | $161,000 |
| 2015 | $11,016 | $288,000 | $127,000 | $161,000 |
| 2014 | $10,814 | $288,000 | $127,000 | $161,000 |
Source: Public Records
Map
Nearby Homes
Your Personal Tour Guide
Ask me questions while you tour the home.