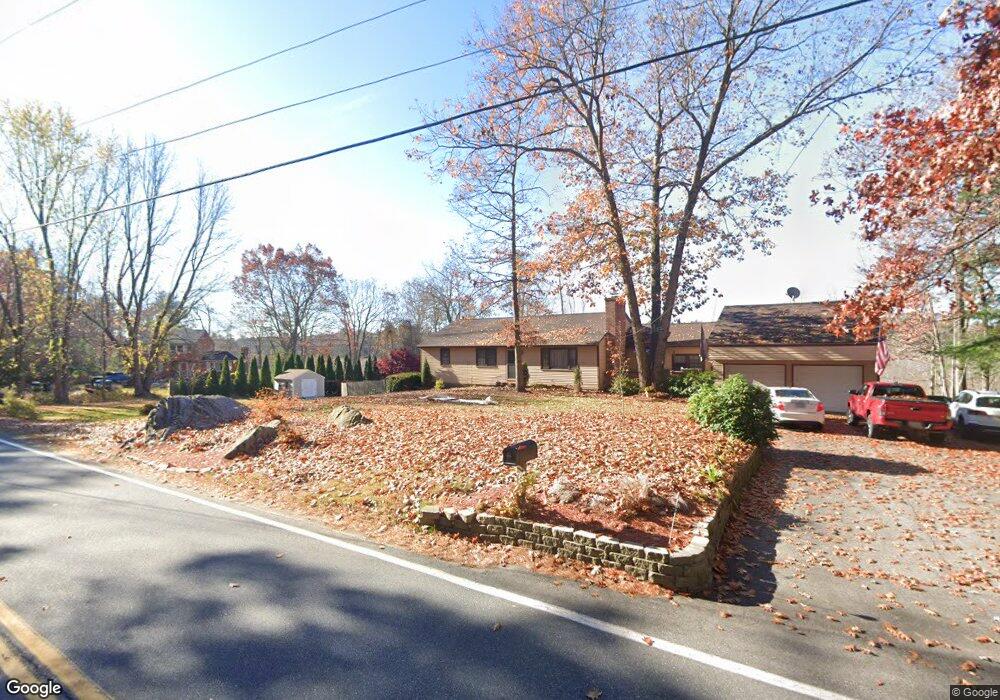
34 Hall Rd Londonderry, NH 03053
Estimated Value: $523,000 - $664,000
3
Beds
4
Baths
1,526
Sq Ft
$385/Sq Ft
Est. Value
About This Home
This home is located at 34 Hall Rd, Londonderry, NH 03053 and is currently estimated at $587,734, approximately $385 per square foot. 34 Hall Rd is a home with nearby schools including North Londonderry Elementary School, Londonderry Middle School, and Londonderry Senior High School.
Ownership History
Date
Name
Owned For
Owner Type
Purchase Details
Closed on
Sep 19, 2025
Sold by
Donnelly Mary A
Bought by
Mary Donnelly T2025 and Mary Donnelly
Current Estimated Value
Purchase Details
Closed on
Mar 28, 2016
Sold by
Radloff Glen N
Bought by
Randloff Mary A
Home Financials for this Owner
Home Financials are based on the most recent Mortgage that was taken out on this home.
Original Mortgage
$219,678
Interest Rate
3.65%
Mortgage Type
FHA
Purchase Details
Closed on
Aug 27, 1999
Sold by
Beneficial Svgs Bk
Bought by
Radloff Glen N and Radloff Mary A
Purchase Details
Closed on
May 7, 1999
Sold by
Dyer Stanley A and Dyer Karleen K
Bought by
Beneficial Mutual Svgs
Create a Home Valuation Report for This Property
The Home Valuation Report is an in-depth analysis detailing your home's value as well as a comparison with similar homes in the area
Home Values in the Area
Average Home Value in this Area
Purchase History
| Date | Buyer | Sale Price | Title Company |
|---|---|---|---|
| Mary Donnelly T2025 | -- | -- | |
| Donnelly Mary A | -- | -- | |
| Randloff Mary A | -- | -- | |
| Randloff Mary A | -- | -- | |
| Radloff Glen N | $108,000 | -- | |
| Radloff Glen N | $108,000 | -- | |
| Beneficial Mutual Svgs | $107,900 | -- | |
| Beneficial Mutual Svgs | $107,900 | -- |
Source: Public Records
Mortgage History
| Date | Status | Borrower | Loan Amount |
|---|---|---|---|
| Previous Owner | Randloff Mary A | $219,678 | |
| Previous Owner | Beneficial Mutual Svgs | $200,600 | |
| Previous Owner | Beneficial Mutual Svgs | $10,000 | |
| Previous Owner | Beneficial Mutual Svgs | $217,000 |
Source: Public Records
Tax History Compared to Growth
Tax History
| Year | Tax Paid | Tax Assessment Tax Assessment Total Assessment is a certain percentage of the fair market value that is determined by local assessors to be the total taxable value of land and additions on the property. | Land | Improvement |
|---|---|---|---|---|
| 2024 | $7,310 | $452,900 | $170,900 | $282,000 |
| 2023 | $7,088 | $452,900 | $170,900 | $282,000 |
| 2022 | $6,958 | $376,500 | $128,100 | $248,400 |
| 2021 | $6,920 | $376,500 | $128,100 | $248,400 |
| 2020 | $6,039 | $300,300 | $106,800 | $193,500 |
| 2019 | $5,823 | $300,300 | $106,800 | $193,500 |
| 2018 | $5,729 | $262,800 | $89,000 | $173,800 |
| 2017 | $5,679 | $262,800 | $89,000 | $173,800 |
| 2016 | $5,351 | $248,900 | $89,000 | $159,900 |
| 2015 | $5,232 | $248,900 | $89,000 | $159,900 |
| 2014 | $5,249 | $248,900 | $89,000 | $159,900 |
| 2011 | -- | $255,400 | $89,000 | $166,400 |
Source: Public Records
Map
Nearby Homes
- 27 Buckingham Dr
- 28 Barksdale Ave
- 8 Barksdale Ave
- 15 Harvey Rd
- 17 Welch Rd
- 32 Noyes Rd
- 4 Crestview Cir Unit 119
- 5 Webster Rd
- 38 Bartley Hill Rd
- 50 Bartley Hill Rd
- 36 Perkins Rd
- 193 Fieldstone Dr
- 193 Fieldstone Dr Unit 193
- 35 Red Deer Rd
- 118 Fieldstone Dr Unit 118
- 8 Iroquois Cir
- 169 Fieldstone Dr
- 224 High Range Rd
- 10 Auburn Rd
- 103 Rockingham Rd Unit 1