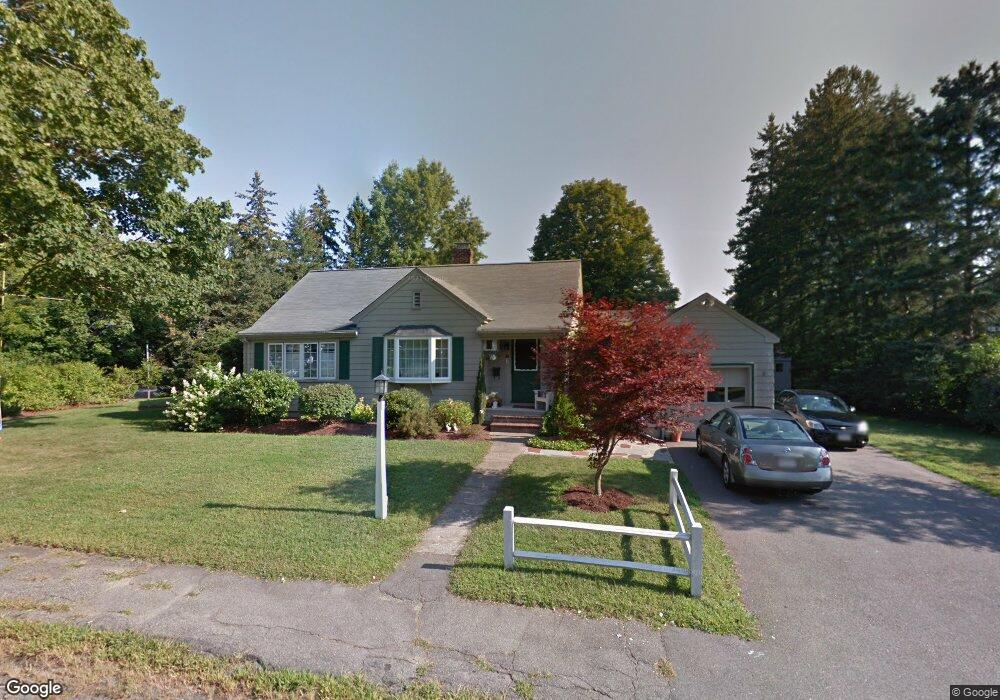
34 Hanson Ave Walpole, MA 02081
Estimated Value: $691,000 - $768,000
3
Beds
1
Bath
1,949
Sq Ft
$372/Sq Ft
Est. Value
About This Home
This home is located at 34 Hanson Ave, Walpole, MA 02081 and is currently estimated at $725,362, approximately $372 per square foot. 34 Hanson Ave is a home located in Norfolk County with nearby schools including Fisher School, Walpole Middle School, and Walpole High School.
Ownership History
Date
Name
Owned For
Owner Type
Purchase Details
Closed on
May 5, 2025
Sold by
Amicangelo Steven and Amicangelo Elizabeth
Bought by
Amicangelo Ret and Amicangelo
Current Estimated Value
Purchase Details
Closed on
Oct 7, 1992
Sold by
Crane Daniel B and Crane Patricia B
Bought by
Amicangelo Steven and Amicangelo Elizabet
Home Financials for this Owner
Home Financials are based on the most recent Mortgage that was taken out on this home.
Original Mortgage
$80,000
Interest Rate
7.99%
Mortgage Type
Purchase Money Mortgage
Create a Home Valuation Report for This Property
The Home Valuation Report is an in-depth analysis detailing your home's value as well as a comparison with similar homes in the area
Home Values in the Area
Average Home Value in this Area
Purchase History
| Date | Buyer | Sale Price | Title Company |
|---|---|---|---|
| Amicangelo Ret | -- | None Available | |
| Amicangelo Ret | -- | None Available | |
| Amicangelo Steven | $170,000 | -- | |
| Amicangelo Steven | $170,000 | -- |
Source: Public Records
Mortgage History
| Date | Status | Borrower | Loan Amount |
|---|---|---|---|
| Previous Owner | Amicangelo Steven | $90,000 | |
| Previous Owner | Amicangelo Steven | $12,500 | |
| Previous Owner | Amicangelo Steven | $80,000 |
Source: Public Records
Tax History
| Year | Tax Paid | Tax Assessment Tax Assessment Total Assessment is a certain percentage of the fair market value that is determined by local assessors to be the total taxable value of land and additions on the property. | Land | Improvement |
|---|---|---|---|---|
| 2025 | $7,926 | $617,800 | $289,100 | $328,700 |
| 2024 | $7,669 | $580,100 | $278,000 | $302,100 |
| 2023 | $7,396 | $532,500 | $241,700 | $290,800 |
| 2022 | $6,971 | $482,100 | $223,800 | $258,300 |
| 2021 | $6,543 | $440,900 | $211,200 | $229,700 |
| 2020 | $6,381 | $425,700 | $199,200 | $226,500 |
| 2019 | $6,158 | $407,800 | $191,600 | $216,200 |
| 2018 | $5,874 | $384,700 | $184,400 | $200,300 |
| 2017 | $5,678 | $370,400 | $177,300 | $193,100 |
| 2016 | $5,367 | $344,900 | $170,500 | $174,400 |
| 2015 | $5,183 | $330,100 | $162,200 | $167,900 |
| 2014 | $4,964 | $315,000 | $162,200 | $152,800 |
Source: Public Records
Map
Nearby Homes
- 881 Main St Unit 9
- 818 Main St
- 6 Litchfields Way
- 65-67 Diamond St
- 222 School St Unit 9
- 224 School St Unit 9
- 28 Eastover Rd Unit 28
- 56 North St
- 2 Kendall St
- 32 Rainbow Pond Dr Unit B1
- 11 Clark Ave
- 50 Riverside Place
- 1110 Main St
- 260 Elm St
- 26 Drake Cir
- 7 Tilton Ct Unit Ct
- 106 Lewis Ave
- 145 South St Unit 5
- 145 South St Unit 18
- 291 Plimpton St
Your Personal Tour Guide
Ask me questions while you tour the home.