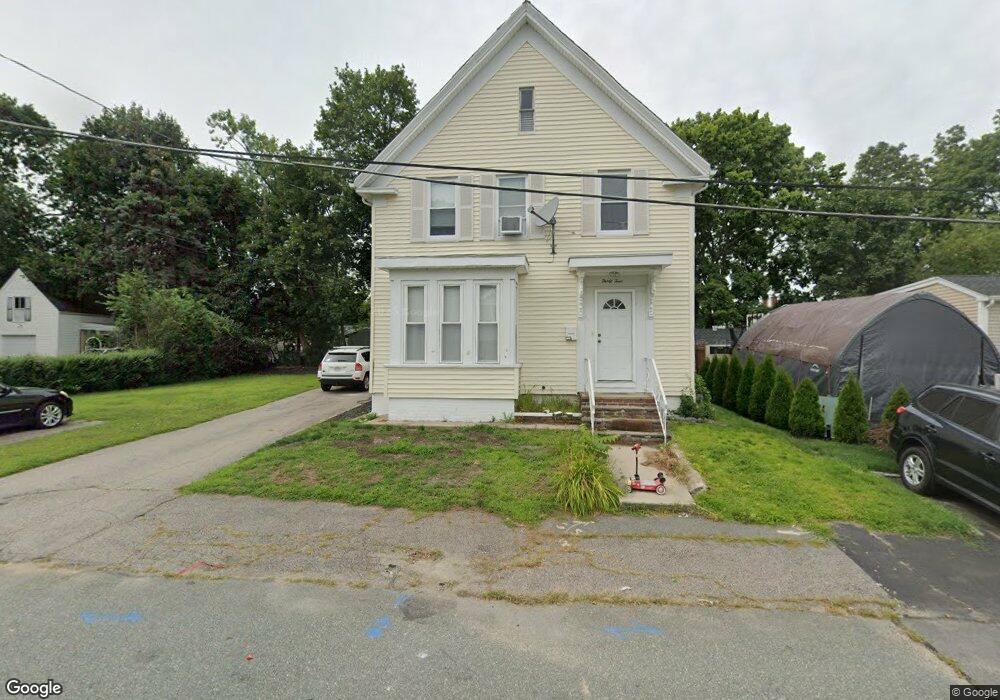
34 Hemlock Ave Unit 2 Brockton, MA 02302
Clifton Heights NeighborhoodEstimated Value: $470,000 - $733,000
2
Beds
1
Bath
800
Sq Ft
$770/Sq Ft
Est. Value
About This Home
This home is located at 34 Hemlock Ave Unit 2, Brockton, MA 02302 and is currently estimated at $616,022, approximately $770 per square foot. 34 Hemlock Ave Unit 2 is a home located in Plymouth County with nearby schools including John F. Kennedy Elementary School, Davis K-8 School, and South Middle School.
Ownership History
Date
Name
Owned For
Owner Type
Purchase Details
Closed on
Sep 15, 2016
Sold by
Norwood Mark G
Bought by
Brito-Depina Nicole T
Current Estimated Value
Home Financials for this Owner
Home Financials are based on the most recent Mortgage that was taken out on this home.
Original Mortgage
$277,382
Outstanding Balance
$220,271
Interest Rate
3.25%
Mortgage Type
FHA
Estimated Equity
$395,751
Purchase Details
Closed on
May 28, 1992
Sold by
Bearce William C
Bought by
Custard Jerome and Custard Dorothy L
Create a Home Valuation Report for This Property
The Home Valuation Report is an in-depth analysis detailing your home's value as well as a comparison with similar homes in the area
Home Values in the Area
Average Home Value in this Area
Purchase History
| Date | Buyer | Sale Price | Title Company |
|---|---|---|---|
| Brito-Depina Nicole T | $282,500 | -- | |
| Custard Jerome | $21,406 | -- |
Source: Public Records
Mortgage History
| Date | Status | Borrower | Loan Amount |
|---|---|---|---|
| Open | Brito-Depina Nicole T | $277,382 | |
| Previous Owner | Custard Jerome | $27,000 | |
| Previous Owner | Custard Jerome | $234,500 |
Source: Public Records
Tax History Compared to Growth
Tax History
| Year | Tax Paid | Tax Assessment Tax Assessment Total Assessment is a certain percentage of the fair market value that is determined by local assessors to be the total taxable value of land and additions on the property. | Land | Improvement |
|---|---|---|---|---|
| 2025 | $7,207 | $595,100 | $139,700 | $455,400 |
| 2024 | $6,898 | $573,900 | $139,700 | $434,200 |
| 2023 | $6,882 | $530,200 | $103,800 | $426,400 |
| 2022 | $6,558 | $469,400 | $94,400 | $375,000 |
| 2021 | $5,899 | $406,800 | $78,300 | $328,500 |
| 2020 | $4,562 | $301,100 | $73,400 | $227,700 |
| 2019 | $4,881 | $314,100 | $71,600 | $242,500 |
| 2018 | $4,437 | $276,300 | $71,600 | $204,700 |
| 2017 | $3,994 | $248,100 | $71,600 | $176,500 |
| 2016 | $3,665 | $211,100 | $69,400 | $141,700 |
| 2015 | $3,225 | $177,700 | $69,400 | $108,300 |
| 2014 | $2,944 | $162,400 | $69,400 | $93,000 |
Source: Public Records
Map
Nearby Homes