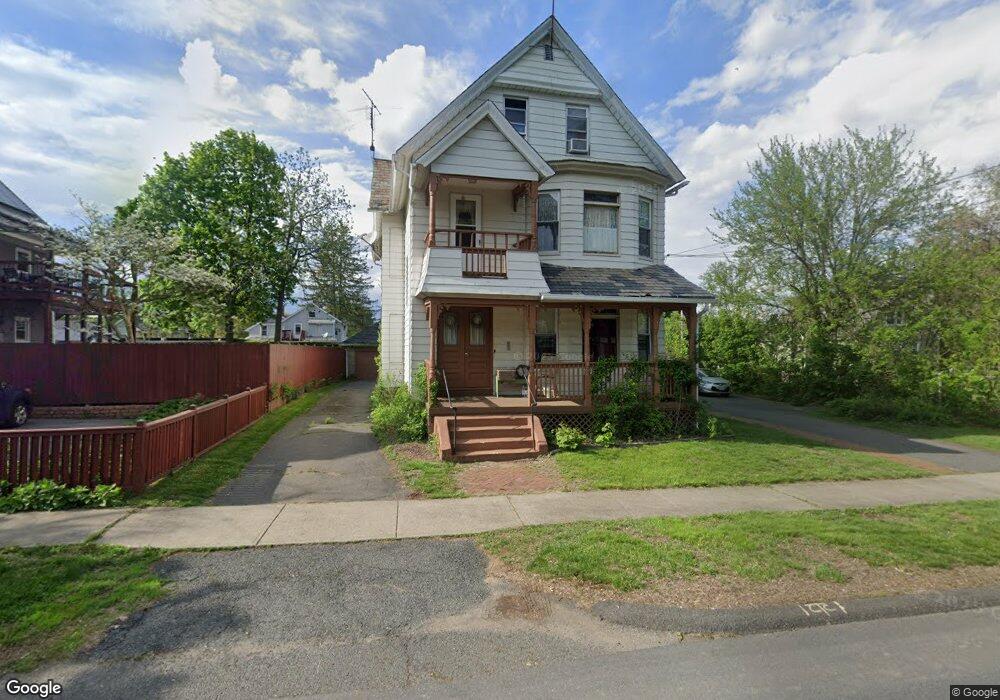
34 High St West Springfield, MA 01089
Estimated Value: $363,290 - $399,000
6
Beds
2
Baths
2,432
Sq Ft
$159/Sq Ft
Est. Value
About This Home
This home is located at 34 High St, West Springfield, MA 01089 and is currently estimated at $385,573, approximately $158 per square foot. 34 High St is a home located in Hampden County with nearby schools including West Springfield High School, Hampden Charter School of Science West, and St Thomas The Apostle School.
Ownership History
Date
Name
Owned For
Owner Type
Purchase Details
Closed on
Nov 24, 2014
Sold by
Sanborn Kevin P
Bought by
Kevin P Sanborn Ret
Current Estimated Value
Purchase Details
Closed on
Sep 6, 2005
Sold by
Yermakova Nina and Mnatsakanyan Valeriy
Bought by
Sanborn Kevin P
Home Financials for this Owner
Home Financials are based on the most recent Mortgage that was taken out on this home.
Original Mortgage
$195,000
Interest Rate
5.81%
Mortgage Type
Purchase Money Mortgage
Purchase Details
Closed on
May 11, 1995
Sold by
Downey Side Inc
Bought by
Mnatsakanyan Valeriy and Yermakova Nina
Home Financials for this Owner
Home Financials are based on the most recent Mortgage that was taken out on this home.
Original Mortgage
$66,500
Interest Rate
8.31%
Mortgage Type
Purchase Money Mortgage
Create a Home Valuation Report for This Property
The Home Valuation Report is an in-depth analysis detailing your home's value as well as a comparison with similar homes in the area
Home Values in the Area
Average Home Value in this Area
Purchase History
| Date | Buyer | Sale Price | Title Company |
|---|---|---|---|
| Kevin P Sanborn Ret | -- | -- | |
| Sanborn Kevin P | $217,500 | -- | |
| Mnatsakanyan Valeriy | $70,000 | -- |
Source: Public Records
Mortgage History
| Date | Status | Borrower | Loan Amount |
|---|---|---|---|
| Previous Owner | Mnatsakanyan Valeriy | $181,250 | |
| Previous Owner | Sanborn Kevin P | $195,000 | |
| Previous Owner | Mnatsakanyan Valeriy | $97,000 | |
| Previous Owner | Mnatsakanyan Valeriy | $12,500 | |
| Previous Owner | Mnatsakanyan Valeriy | $66,500 |
Source: Public Records
Tax History
| Year | Tax Paid | Tax Assessment Tax Assessment Total Assessment is a certain percentage of the fair market value that is determined by local assessors to be the total taxable value of land and additions on the property. | Land | Improvement |
|---|---|---|---|---|
| 2025 | $4,477 | $301,100 | $99,300 | $201,800 |
| 2024 | $4,459 | $301,100 | $99,300 | $201,800 |
| 2023 | $4,068 | $261,800 | $97,100 | $164,700 |
| 2022 | $3,986 | $252,900 | $88,200 | $164,700 |
| 2021 | $3,459 | $204,700 | $81,500 | $123,200 |
| 2020 | $3,435 | $202,200 | $81,500 | $120,700 |
| 2019 | $3,429 | $202,200 | $81,500 | $120,700 |
| 2018 | $3,448 | $202,200 | $81,500 | $120,700 |
| 2017 | $3,448 | $202,200 | $81,500 | $120,700 |
| 2016 | $3,354 | $197,400 | $76,700 | $120,700 |
| 2015 | $3,468 | $204,100 | $75,200 | $128,900 |
| 2014 | $842 | $204,100 | $75,200 | $128,900 |
Source: Public Records
Map
Nearby Homes
Your Personal Tour Guide
Ask me questions while you tour the home.