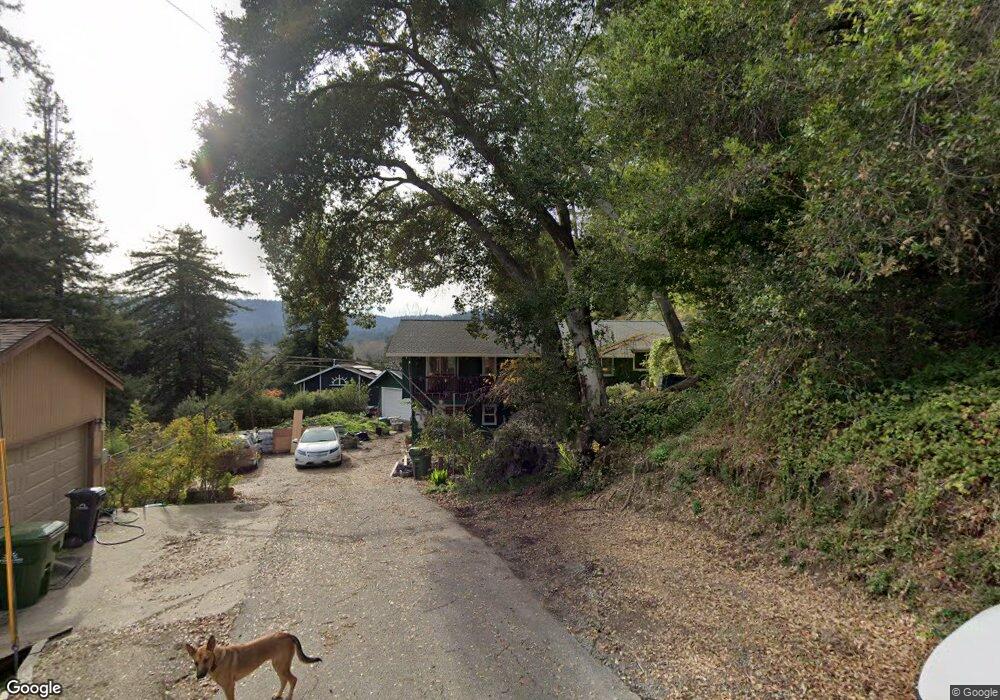
34 Highland Ave Felton, CA 95018
Estimated Value: $868,342 - $985,000
2
Beds
2
Baths
1,495
Sq Ft
$609/Sq Ft
Est. Value
About This Home
This home is located at 34 Highland Ave, Felton, CA 95018 and is currently estimated at $911,086, approximately $609 per square foot. 34 Highland Ave is a home located in Santa Cruz County with nearby schools including San Lorenzo Valley Elementary School, San Lorenzo Valley Middle School, and San Lorenzo Valley High School.
Ownership History
Date
Name
Owned For
Owner Type
Purchase Details
Closed on
Oct 6, 2020
Sold by
Grote William F and Lord Wendy
Bought by
Grote William F and Lord Wendy W
Current Estimated Value
Home Financials for this Owner
Home Financials are based on the most recent Mortgage that was taken out on this home.
Original Mortgage
$340,800
Interest Rate
2.9%
Mortgage Type
New Conventional
Purchase Details
Closed on
Sep 13, 2016
Sold by
Grote Ii William F and Lord Wendy W
Bought by
Grote William F and Lord Wendy W
Home Financials for this Owner
Home Financials are based on the most recent Mortgage that was taken out on this home.
Original Mortgage
$373,500
Interest Rate
3.43%
Mortgage Type
New Conventional
Purchase Details
Closed on
Feb 26, 2009
Sold by
Lord Wendy W and Grote William F
Bought by
Grote William F and Lord Wendy W
Create a Home Valuation Report for This Property
The Home Valuation Report is an in-depth analysis detailing your home's value as well as a comparison with similar homes in the area
Home Values in the Area
Average Home Value in this Area
Purchase History
| Date | Buyer | Sale Price | Title Company |
|---|---|---|---|
| Grote William F | -- | Old Republic Title Company | |
| Grote William F | -- | Old Republic Title Company | |
| Grote William F | -- | Stewart Title Of Ca Inc | |
| Grote Ii William F | -- | Stewart Title Of Ca Inc | |
| Grote William F | -- | None Available |
Source: Public Records
Mortgage History
| Date | Status | Borrower | Loan Amount |
|---|---|---|---|
| Closed | Grote William F | $340,800 | |
| Closed | Grote Ii William F | $373,500 |
Source: Public Records
Tax History Compared to Growth
Tax History
| Year | Tax Paid | Tax Assessment Tax Assessment Total Assessment is a certain percentage of the fair market value that is determined by local assessors to be the total taxable value of land and additions on the property. | Land | Improvement |
|---|---|---|---|---|
| 2025 | $4,403 | $362,898 | $180,378 | $182,520 |
| 2023 | $4,476 | $348,806 | $173,374 | $175,432 |
| 2022 | $4,368 | $341,966 | $169,974 | $171,992 |
| 2021 | $4,186 | $335,260 | $166,640 | $168,620 |
| 2020 | $4,028 | $331,824 | $164,932 | $166,892 |
| 2019 | $3,824 | $325,318 | $161,698 | $163,620 |
| 2018 | $3,754 | $318,938 | $158,528 | $160,410 |
| 2017 | $3,696 | $312,684 | $155,420 | $157,264 |
| 2016 | $3,653 | $306,552 | $152,372 | $154,180 |
| 2015 | $3,567 | $301,948 | $150,084 | $151,864 |
| 2014 | $3,509 | $296,034 | $147,144 | $148,890 |
Source: Public Records
Map
Nearby Homes
- 460 River Rd
- 12 Canyon Rd
- 44 Pine Ave
- Lot 08 Madrone Ave
- 7415 Hihn Rd
- 243 Ada Ave
- 7409 Hihn Rd
- 0 Carroll Ave
- 833 Skyline Dr
- 359 Redwood Rd
- 414 Prospect Ave
- 220 Lazywoods Rd
- 7470 Highway 9
- 620 Condor Ave
- 1022 Brookside Dr
- 345 Condor Ave
- 1151 Lakeside Dr
- 1415 Lost Acre Dr
- 0 Toll House Gulch Rd
- 234 Caledonium Ave
- 35 Highland Ave
- 6515 E Zayante Rd
- 6495 E Zayante Rd
- 30 Highland Ave
- 31 Highland Ave
- 6479 E Zayante Rd
- 29 Highland Ave
- 27 Highland Ave
- 4100 E Zayante Rd
- 25 Highland Ave
- 21 Highland Ave
- 96 Woodmill Ln
- 19 Highland Ave
- 18 Highland Ave
- 6643 E Zayante Rd
- 95 Woodmill Ln
- 99 Woodmill Ln
- 87 Woodmill Ln
- 0 Highland Ave Unit ML81046520
- 8 Redwood Cir