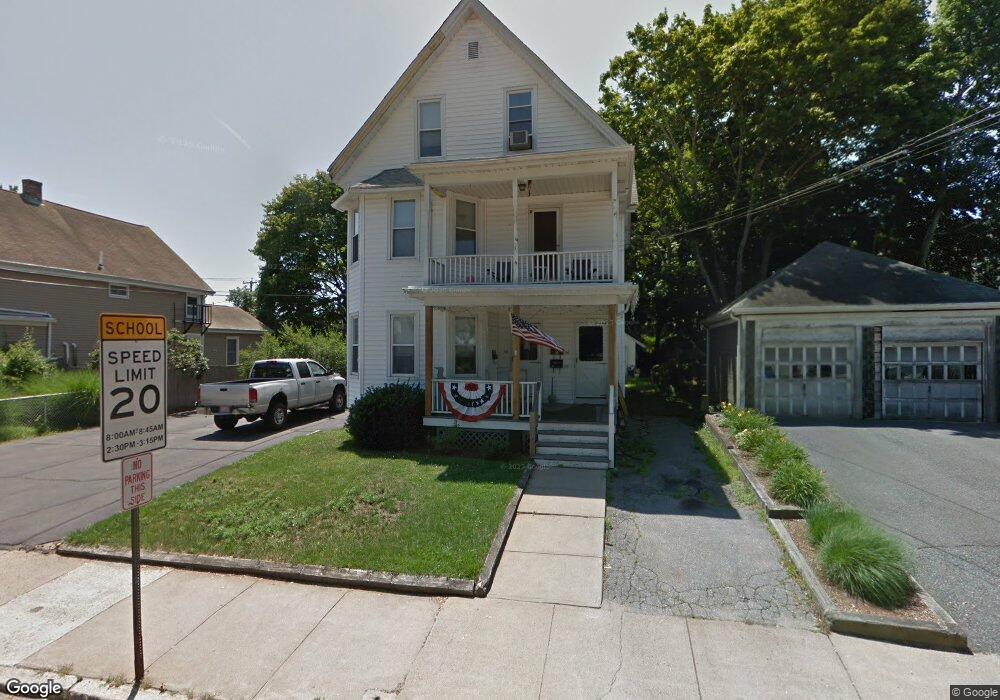
34 Hodges St Attleboro, MA 02703
Estimated Value: $689,000 - $754,000
6
Beds
3
Baths
3,260
Sq Ft
$222/Sq Ft
Est. Value
About This Home
This home is located at 34 Hodges St, Attleboro, MA 02703 and is currently estimated at $722,723, approximately $221 per square foot. 34 Hodges St is a home located in Bristol County with nearby schools including Thomas E. Willett School, Cyril K. Brennan Middle School, and Attleboro High School.
Ownership History
Date
Name
Owned For
Owner Type
Purchase Details
Closed on
Feb 17, 2009
Sold by
Daddario Amy E and Johnson Amy E
Bought by
Johnson Carl W
Current Estimated Value
Home Financials for this Owner
Home Financials are based on the most recent Mortgage that was taken out on this home.
Original Mortgage
$260,800
Outstanding Balance
$166,263
Interest Rate
5.26%
Mortgage Type
Purchase Money Mortgage
Estimated Equity
$556,460
Purchase Details
Closed on
Jul 14, 2003
Sold by
Daddario Amy E and Johnson Carl W
Bought by
Johnson Amy E and Johnson Carl W
Purchase Details
Closed on
Mar 15, 2001
Sold by
Bryson John M and Bryson Jacqueline
Bought by
Daddario Amy E and Johnson Carl W
Home Financials for this Owner
Home Financials are based on the most recent Mortgage that was taken out on this home.
Original Mortgage
$208,849
Interest Rate
7.01%
Mortgage Type
Purchase Money Mortgage
Create a Home Valuation Report for This Property
The Home Valuation Report is an in-depth analysis detailing your home's value as well as a comparison with similar homes in the area
Home Values in the Area
Average Home Value in this Area
Purchase History
| Date | Buyer | Sale Price | Title Company |
|---|---|---|---|
| Johnson Carl W | -- | -- | |
| Johnson Amy E | -- | -- | |
| Daddario Amy E | $210,500 | -- |
Source: Public Records
Mortgage History
| Date | Status | Borrower | Loan Amount |
|---|---|---|---|
| Open | Johnson Carl W | $260,800 | |
| Previous Owner | Daddario Amy E | $208,849 |
Source: Public Records
Tax History Compared to Growth
Tax History
| Year | Tax Paid | Tax Assessment Tax Assessment Total Assessment is a certain percentage of the fair market value that is determined by local assessors to be the total taxable value of land and additions on the property. | Land | Improvement |
|---|---|---|---|---|
| 2025 | $6,881 | $548,300 | $126,100 | $422,200 |
| 2024 | $6,646 | $522,100 | $126,100 | $396,000 |
| 2023 | $5,904 | $431,300 | $114,600 | $316,700 |
| 2022 | $5,397 | $373,500 | $109,200 | $264,300 |
| 2021 | $3,779 | $351,200 | $105,000 | $246,200 |
| 2020 | $4,245 | $334,100 | $102,000 | $232,100 |
| 2019 | $3,711 | $324,900 | $100,000 | $224,900 |
| 2018 | $14 | $284,300 | $97,100 | $187,200 |
| 2017 | $0 | $287,300 | $97,100 | $190,200 |
| 2016 | $3,862 | $260,600 | $95,300 | $165,300 |
| 2015 | $3,638 | $247,300 | $95,300 | $152,000 |
| 2014 | $3,341 | $225,000 | $90,800 | $134,200 |
Source: Public Records
Map
Nearby Homes
- 29 Hodges St
- 43 Elizabeth St
- 10 John St
- 62 Elizabeth St
- 140 N Main St Unit 3B
- 64 Mechanic St Unit 3
- 64 Mechanic St
- 392 N Main St
- 46 Berwick Rd
- 74 West St Unit 5
- 17 1st St
- 54 Bank St
- 24 Park St Unit 4F
- 32 Park St Unit 4
- 125 County St
- 49 Dennis St
- 6 & 6R Holman St
- 8 Holman St
- 46 Oak St
- 10 Holman St Unit A