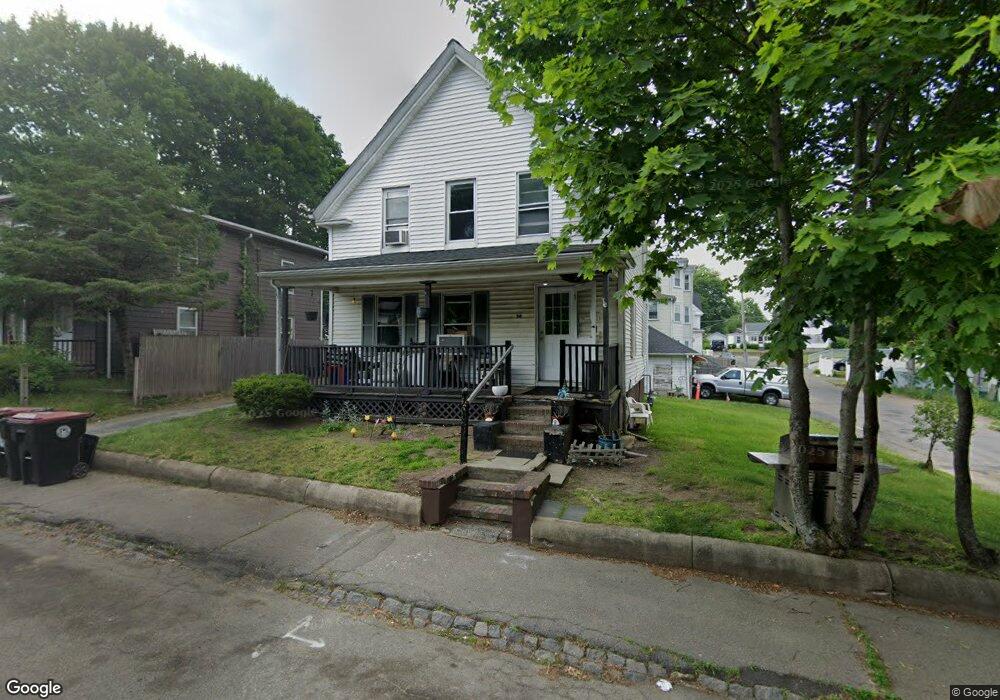
34 James St Brockton, MA 02302
Clifton Heights NeighborhoodEstimated Value: $425,000 - $675,000
4
Beds
2
Baths
1,509
Sq Ft
$386/Sq Ft
Est. Value
About This Home
This home is located at 34 James St, Brockton, MA 02302 and is currently estimated at $582,673, approximately $386 per square foot. 34 James St is a home located in Plymouth County with nearby schools including John F. Kennedy Elementary School, Davis K-8 School, and South Middle School.
Ownership History
Date
Name
Owned For
Owner Type
Purchase Details
Closed on
Sep 25, 2018
Sold by
Ambrose Peter J
Bought by
Peter J Ambrose 2018 R
Current Estimated Value
Purchase Details
Closed on
Mar 15, 1989
Sold by
Cleary Daniel E
Bought by
Ambrose Peter J
Home Financials for this Owner
Home Financials are based on the most recent Mortgage that was taken out on this home.
Original Mortgage
$80,000
Interest Rate
10.46%
Mortgage Type
Purchase Money Mortgage
Create a Home Valuation Report for This Property
The Home Valuation Report is an in-depth analysis detailing your home's value as well as a comparison with similar homes in the area
Home Values in the Area
Average Home Value in this Area
Purchase History
| Date | Buyer | Sale Price | Title Company |
|---|---|---|---|
| Peter J Ambrose 2018 R | -- | -- | |
| Ambrose Peter J | $100,000 | -- |
Source: Public Records
Mortgage History
| Date | Status | Borrower | Loan Amount |
|---|---|---|---|
| Previous Owner | Ambrose Peter J | $80,000 | |
| Previous Owner | Ambrose Peter J | $119,900 |
Source: Public Records
Tax History Compared to Growth
Tax History
| Year | Tax Paid | Tax Assessment Tax Assessment Total Assessment is a certain percentage of the fair market value that is determined by local assessors to be the total taxable value of land and additions on the property. | Land | Improvement |
|---|---|---|---|---|
| 2025 | $7,099 | $586,200 | $138,500 | $447,700 |
| 2024 | $6,622 | $550,900 | $138,500 | $412,400 |
| 2023 | $6,047 | $465,900 | $103,100 | $362,800 |
| 2022 | $5,849 | $418,700 | $93,700 | $325,000 |
| 2021 | $6,558 | $351,400 | $77,600 | $273,800 |
| 2020 | $4,463 | $294,600 | $72,900 | $221,700 |
| 2019 | $4,550 | $292,800 | $70,900 | $221,900 |
| 2018 | $3,537 | $252,700 | $70,900 | $181,800 |
| 2017 | $3,537 | $219,700 | $70,900 | $148,800 |
| 2016 | $3,423 | $197,200 | $68,700 | $128,500 |
| 2015 | $3,098 | $170,700 | $68,700 | $102,000 |
| 2014 | $2,859 | $157,700 | $68,700 | $89,000 |
Source: Public Records
Map
Nearby Homes