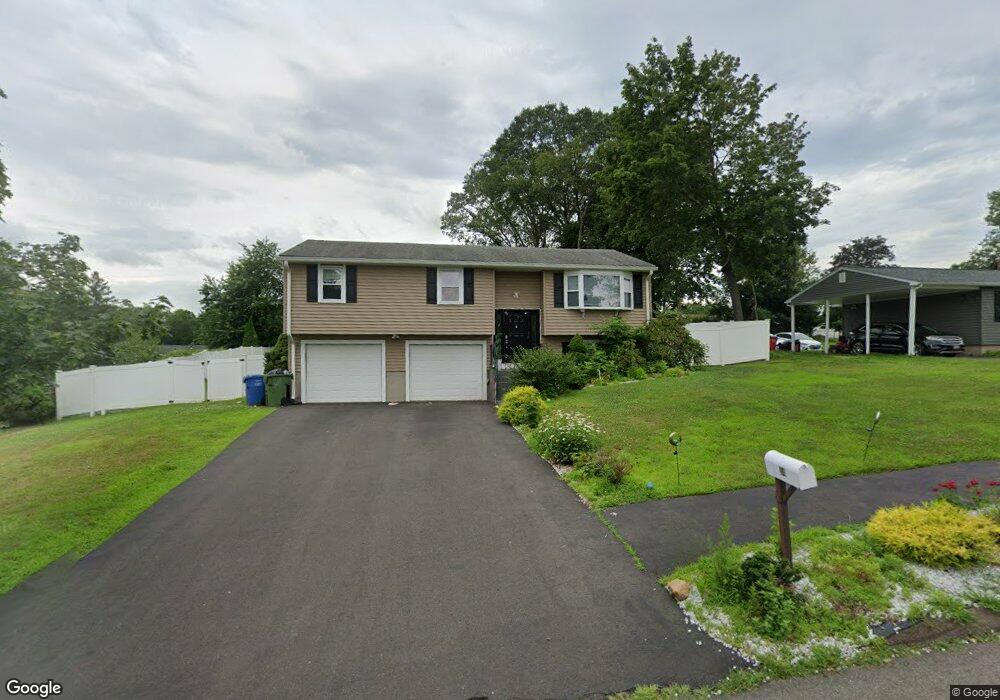
34 Keats Rd Meriden, CT 06451
South Meriden NeighborhoodEstimated Value: $375,000 - $390,000
3
Beds
6
Baths
1,612
Sq Ft
$239/Sq Ft
Est. Value
About This Home
This home is located at 34 Keats Rd, Meriden, CT 06451 and is currently estimated at $385,273, approximately $239 per square foot. 34 Keats Rd is a home located in New Haven County with nearby schools including Hanover School, Lincoln Middle School, and Orville H. Platt High School.
Ownership History
Date
Name
Owned For
Owner Type
Purchase Details
Closed on
Mar 26, 2018
Sold by
Trager Joshua
Bought by
Marquez Joseph A
Current Estimated Value
Home Financials for this Owner
Home Financials are based on the most recent Mortgage that was taken out on this home.
Original Mortgage
$176,739
Outstanding Balance
$149,474
Interest Rate
3.75%
Mortgage Type
FHA
Estimated Equity
$235,799
Purchase Details
Closed on
Jul 8, 2010
Sold by
Gordon 3Rd Samuel H and Gordon Dian Z
Bought by
Trager Joshua and Trager Art
Home Financials for this Owner
Home Financials are based on the most recent Mortgage that was taken out on this home.
Original Mortgage
$192,449
Interest Rate
5.5%
Mortgage Type
FHA
Purchase Details
Closed on
Nov 26, 1997
Sold by
Barrington Financial
Bought by
Gordon Samuel H and Gordon Diane Z
Purchase Details
Closed on
Aug 12, 1991
Sold by
Miller George T
Bought by
Senopole Elizabeth and Senopole Arthur
Create a Home Valuation Report for This Property
The Home Valuation Report is an in-depth analysis detailing your home's value as well as a comparison with similar homes in the area
Home Values in the Area
Average Home Value in this Area
Purchase History
| Date | Buyer | Sale Price | Title Company |
|---|---|---|---|
| Marquez Joseph A | $180,000 | -- | |
| Trager Joshua | $196,000 | -- | |
| Gordon Samuel H | $103,000 | -- | |
| Senopole Elizabeth | $53,000 | -- |
Source: Public Records
Mortgage History
| Date | Status | Borrower | Loan Amount |
|---|---|---|---|
| Open | Senopole Elizabeth | $176,739 | |
| Closed | Senopole Elizabeth | $11,800 | |
| Previous Owner | Senopole Elizabeth | $192,449 |
Source: Public Records
Tax History Compared to Growth
Tax History
| Year | Tax Paid | Tax Assessment Tax Assessment Total Assessment is a certain percentage of the fair market value that is determined by local assessors to be the total taxable value of land and additions on the property. | Land | Improvement |
|---|---|---|---|---|
| 2024 | $6,214 | $171,150 | $69,790 | $101,360 |
| 2023 | $5,954 | $171,150 | $69,790 | $101,360 |
| 2022 | $5,646 | $171,150 | $69,790 | $101,360 |
| 2021 | $5,434 | $133,000 | $55,160 | $77,840 |
| 2020 | $5,434 | $133,000 | $55,160 | $77,840 |
| 2019 | $5,434 | $133,000 | $55,160 | $77,840 |
| 2018 | $5,458 | $133,000 | $55,160 | $77,840 |
| 2017 | $5,309 | $133,000 | $55,160 | $77,840 |
| 2016 | $4,785 | $130,620 | $47,180 | $83,440 |
| 2015 | $4,785 | $130,620 | $47,180 | $83,440 |
| 2014 | $4,668 | $130,620 | $47,180 | $83,440 |
Source: Public Records
Map
Nearby Homes