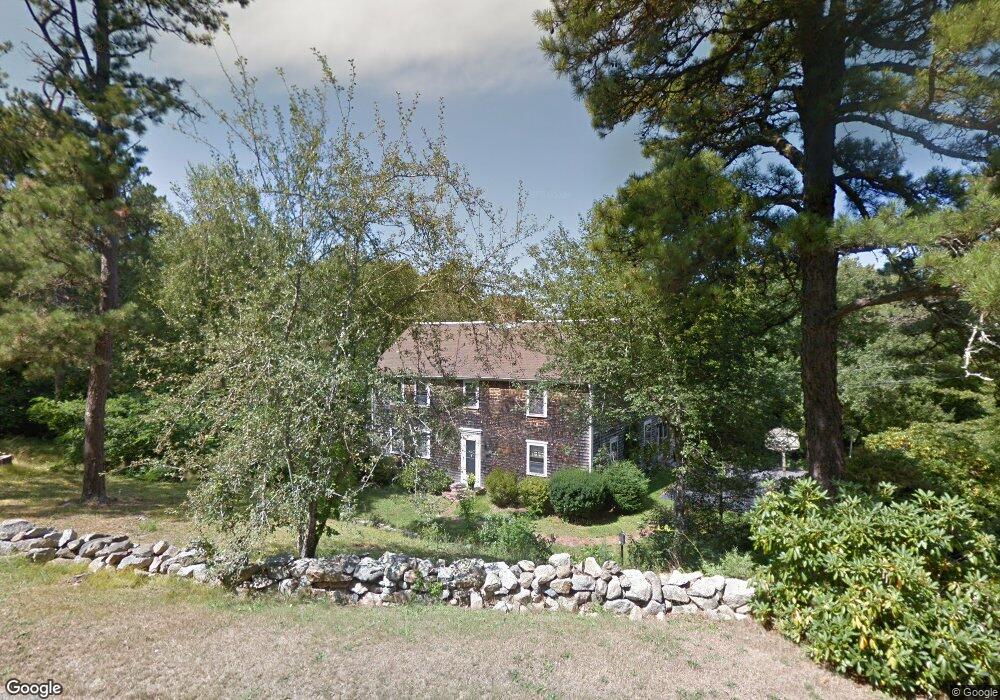
34 Lisa Ln West Barnstable, MA 02668
West Barnstable NeighborhoodEstimated Value: $793,640 - $954,000
4
Beds
3
Baths
2,408
Sq Ft
$376/Sq Ft
Est. Value
About This Home
This home is located at 34 Lisa Ln, West Barnstable, MA 02668 and is currently estimated at $905,410, approximately $376 per square foot. 34 Lisa Ln is a home located in Barnstable County with nearby schools including West Barnstable Elementary School, Barnstable United Elementary School, and Barnstable Intermediate School.
Ownership History
Date
Name
Owned For
Owner Type
Purchase Details
Closed on
Aug 16, 2024
Sold by
Cheryl M Moniz Irt and Moniz
Bought by
Cheryl M Moniz Irt and Moniz
Current Estimated Value
Purchase Details
Closed on
Dec 3, 2021
Sold by
Moniz Cheryl M
Bought by
Cheryl M Moniz Irt and Troup
Create a Home Valuation Report for This Property
The Home Valuation Report is an in-depth analysis detailing your home's value as well as a comparison with similar homes in the area
Home Values in the Area
Average Home Value in this Area
Purchase History
| Date | Buyer | Sale Price | Title Company |
|---|---|---|---|
| Cheryl M Moniz Irt | -- | None Available | |
| Cheryl M Moniz Irt | -- | None Available | |
| Cheryl M Moniz Irt | -- | None Available | |
| Cheryl M Moniz Irt | -- | None Available |
Source: Public Records
Tax History Compared to Growth
Tax History
| Year | Tax Paid | Tax Assessment Tax Assessment Total Assessment is a certain percentage of the fair market value that is determined by local assessors to be the total taxable value of land and additions on the property. | Land | Improvement |
|---|---|---|---|---|
| 2025 | $7,449 | $797,500 | $246,900 | $550,600 |
| 2024 | $6,567 | $765,400 | $246,900 | $518,500 |
| 2023 | $6,056 | $664,800 | $224,400 | $440,400 |
| 2022 | $5,689 | $512,100 | $154,400 | $357,700 |
| 2021 | $5,671 | $483,900 | $156,800 | $327,100 |
| 2020 | $1,941 | $442,700 | $156,800 | $285,900 |
| 2019 | $2,042 | $456,000 | $166,300 | $289,700 |
| 2018 | $2,000 | $441,100 | $193,800 | $247,300 |
| 2017 | $5,312 | $434,000 | $193,800 | $240,200 |
| 2016 | $5,244 | $437,400 | $193,800 | $243,600 |
| 2015 | $5,262 | $440,000 | $192,200 | $247,800 |
Source: Public Records
Map
Nearby Homes
- 50 Wayside Ln
- 665 Route 6a
- 718 Cedar St
- 3 Mulberry Cir
- 75 Old Toll Rd
- 510 Cedar St
- 515 Cedar St
- 6 Harpers Hollow
- 14 Village Dr
- 46 Chase Rd
- 0 Captain Kidd Rd
- 2400 Meetinghouse Way
- 159 Great Hill Rd
- 507 Massachusetts 6a Unit 9
- 282 Parker Rd
- 7 Highfield Dr
- 203 N Shore Blvd Unit D
- 203 N Shore Blvd Unit D
- 420 Massachusetts 6a
- 36 Atkins Rd Unit D2