Estimated Value: $3,372,000 - $4,444,000
5
Beds
5
Baths
3,312
Sq Ft
$1,232/Sq Ft
Est. Value
About This Home
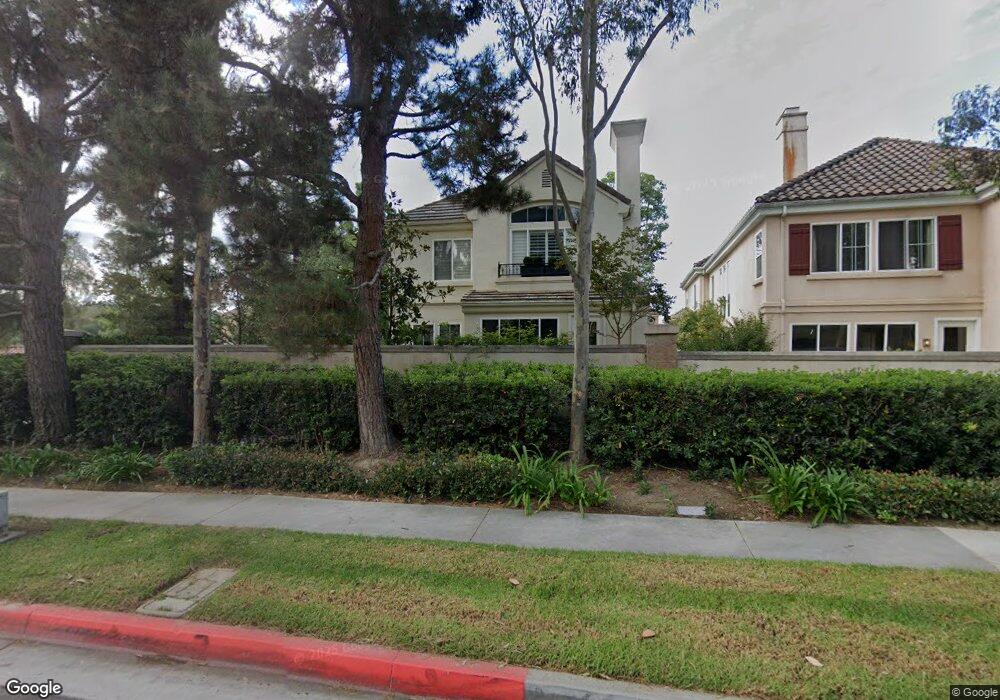
This home is located at 34 Lyon, Newport Coast, CA 92657 and is currently estimated at $4,079,152, approximately $1,231 per square foot. 34 Lyon is a home located in Orange County with nearby schools including Newport Coast Elementary School, Corona del Mar Middle and High School, and Harbor Day School.
Ownership History
Date
Name
Owned For
Owner Type
Purchase Details
Closed on
Sep 28, 2001
Sold by
Nakamura Mark and Nakamura Candace
Bought by
Nakamura Mark K and Nakamura Candace E
Current Estimated Value
Purchase Details
Closed on
Sep 26, 1995
Sold by
The Irvine Company
Bought by
Nakamura Mark and Nakamura Candace
Home Financials for this Owner
Home Financials are based on the most recent Mortgage that was taken out on this home.
Original Mortgage
$300,000
Interest Rate
7.18%
Create a Home Valuation Report for This Property
The Home Valuation Report is an in-depth analysis detailing your home's value as well as a comparison with similar homes in the area
Home Values in the Area
Average Home Value in this Area
Purchase History
| Date | Buyer | Sale Price | Title Company |
|---|---|---|---|
| Nakamura Mark K | -- | -- | |
| Nakamura Mark | $450,000 | First American Title Ins |
Source: Public Records
Mortgage History
| Date | Status | Borrower | Loan Amount |
|---|---|---|---|
| Previous Owner | Nakamura Mark | $300,000 |
Source: Public Records
Tax History Compared to Growth
Tax History
| Year | Tax Paid | Tax Assessment Tax Assessment Total Assessment is a certain percentage of the fair market value that is determined by local assessors to be the total taxable value of land and additions on the property. | Land | Improvement |
|---|---|---|---|---|
| 2025 | $9,957 | $924,233 | $380,066 | $544,167 |
| 2024 | $9,957 | $906,111 | $372,613 | $533,498 |
| 2023 | $9,799 | $888,345 | $365,307 | $523,038 |
| 2022 | $9,630 | $870,927 | $358,144 | $512,783 |
| 2021 | $7,858 | $853,850 | $351,121 | $502,729 |
| 2020 | $9,422 | $845,095 | $347,520 | $497,575 |
| 2019 | $9,377 | $828,525 | $340,706 | $487,819 |
| 2018 | $9,198 | $812,280 | $334,026 | $478,254 |
| 2017 | $9,042 | $796,353 | $327,476 | $468,877 |
| 2016 | $8,713 | $780,739 | $321,055 | $459,684 |
| 2015 | $8,632 | $769,012 | $316,232 | $452,780 |
| 2014 | $9,064 | $753,949 | $310,038 | $443,911 |
Source: Public Records
Map
Nearby Homes