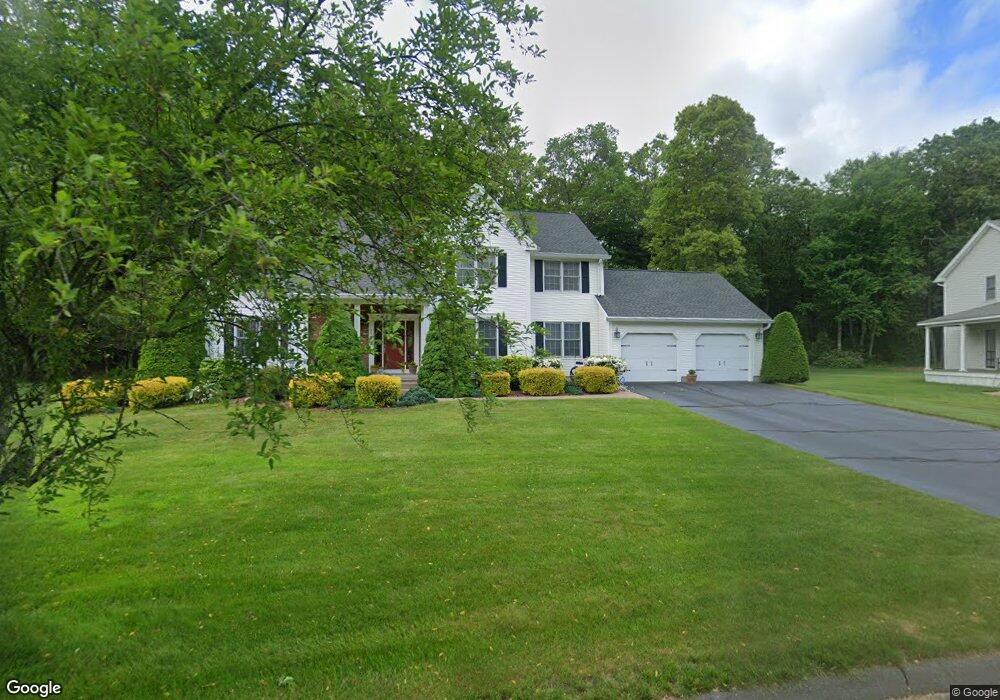
34 Marla Cir Westfield, MA 01085
Estimated Value: $659,284 - $700,000
4
Beds
3
Baths
2,420
Sq Ft
$282/Sq Ft
Est. Value
About This Home
This home is located at 34 Marla Cir, Westfield, MA 01085 and is currently estimated at $681,761, approximately $281 per square foot. 34 Marla Cir is a home located in Hampden County with nearby schools including Westfield High School and Saint Mary High School.
Ownership History
Date
Name
Owned For
Owner Type
Purchase Details
Closed on
Aug 21, 1995
Sold by
Scarfo Constr Inc
Bought by
Figueiredo Franklin and Gaffney Sharon M
Current Estimated Value
Home Financials for this Owner
Home Financials are based on the most recent Mortgage that was taken out on this home.
Original Mortgage
$199,000
Interest Rate
7.61%
Mortgage Type
Purchase Money Mortgage
Create a Home Valuation Report for This Property
The Home Valuation Report is an in-depth analysis detailing your home's value as well as a comparison with similar homes in the area
Home Values in the Area
Average Home Value in this Area
Purchase History
| Date | Buyer | Sale Price | Title Company |
|---|---|---|---|
| Figueiredo Franklin | $235,000 | -- |
Source: Public Records
Mortgage History
| Date | Status | Borrower | Loan Amount |
|---|---|---|---|
| Open | Figueiredo Franklin | $40,000 | |
| Closed | Figueiredo Franklin | $20,000 | |
| Closed | Figueiredo Franklin | $199,000 |
Source: Public Records
Tax History
| Year | Tax Paid | Tax Assessment Tax Assessment Total Assessment is a certain percentage of the fair market value that is determined by local assessors to be the total taxable value of land and additions on the property. | Land | Improvement |
|---|---|---|---|---|
| 2025 | $8,528 | $561,800 | $157,900 | $403,900 |
| 2024 | $8,557 | $535,800 | $143,500 | $392,300 |
| 2023 | $8,278 | $506,400 | $136,800 | $369,600 |
| 2022 | $8,278 | $447,700 | $121,600 | $326,100 |
| 2021 | $8,024 | $425,000 | $114,800 | $310,200 |
| 2020 | $7,781 | $404,200 | $114,800 | $289,400 |
| 2019 | $7,602 | $386,500 | $109,300 | $277,200 |
| 2018 | $7,492 | $387,000 | $109,300 | $277,700 |
| 2017 | $7,314 | $376,600 | $111,000 | $265,600 |
| 2016 | $7,321 | $376,600 | $111,000 | $265,600 |
| 2015 | $6,795 | $366,500 | $111,000 | $255,500 |
| 2014 | $5,088 | $366,500 | $111,000 | $255,500 |
Source: Public Records
Map
Nearby Homes
- 103 Woodcliff Dr
- 120 Woodcliff Dr
- 242 Eastwood Dr
- 24 Francis St
- 24 Sunflower Ln Unit B
- 18 Noble St
- 0 E Mountain Rd
- 189 Springfield Rd Unit 23
- 63 George St
- 19 Arch Rd
- 33 George St
- 25 Dubois St
- 0 Lockhouse Rd Unit 73473161
- 0 Feeding Hills Rd
- Lot 3 Montgomery
- 9 Montgomery St
- 2 Cycle St
- 357 Southampton Rd
- 13 Furrow St
- 19 Kellogg St
Your Personal Tour Guide
Ask me questions while you tour the home.