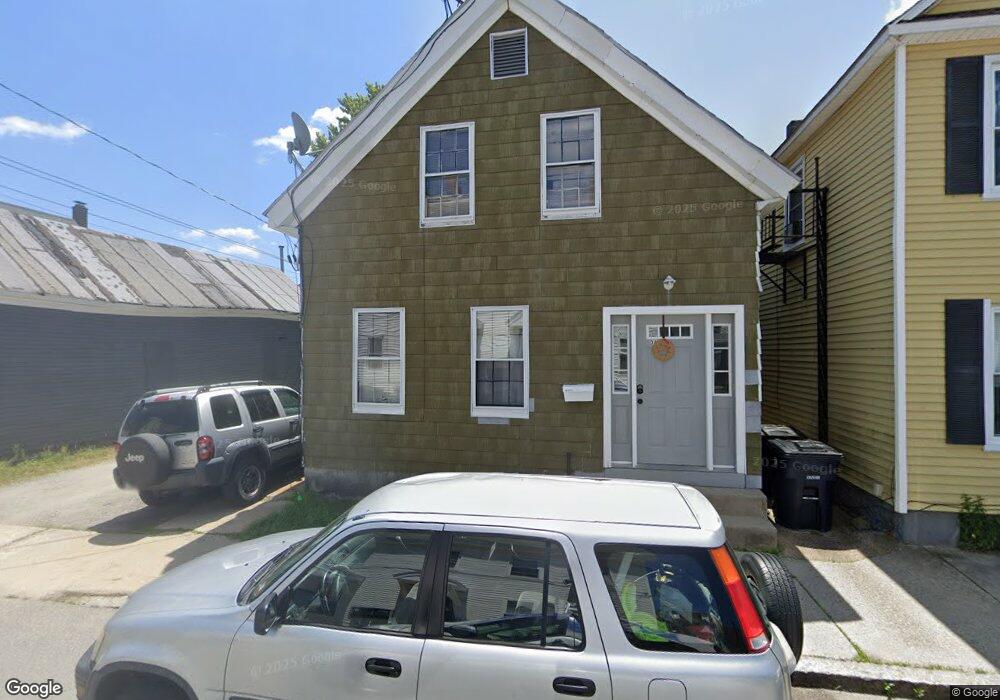
34 Mulberry St Nashua, NH 03060
South End Nashua NeighborhoodEstimated Value: $471,000 - $527,000
4
Beds
2
Baths
1,852
Sq Ft
$272/Sq Ft
Est. Value
About This Home
This home is located at 34 Mulberry St, Nashua, NH 03060 and is currently estimated at $503,241, approximately $271 per square foot. 34 Mulberry St is a home located in Hillsborough County with nearby schools including Ledge Street Elementary School, Elm Street Middle School, and Nashua High School South.
Ownership History
Date
Name
Owned For
Owner Type
Purchase Details
Closed on
Dec 13, 2018
Sold by
Gonzalez Carlos
Bought by
Gonzalez Carlos and Ocasio Judith M
Current Estimated Value
Purchase Details
Closed on
Apr 2, 2001
Sold by
Cortes David
Bought by
Ocasio Judith M
Home Financials for this Owner
Home Financials are based on the most recent Mortgage that was taken out on this home.
Original Mortgage
$145,650
Interest Rate
6.96%
Purchase Details
Closed on
May 8, 1997
Sold by
Richards Ronald N and Richards Doris M
Bought by
Cortes David
Home Financials for this Owner
Home Financials are based on the most recent Mortgage that was taken out on this home.
Original Mortgage
$67,350
Interest Rate
7.88%
Create a Home Valuation Report for This Property
The Home Valuation Report is an in-depth analysis detailing your home's value as well as a comparison with similar homes in the area
Home Values in the Area
Average Home Value in this Area
Purchase History
| Date | Buyer | Sale Price | Title Company |
|---|---|---|---|
| Gonzalez Carlos | -- | -- | |
| Ocasio Judith M | $148,000 | -- | |
| Cortes David | $61,000 | -- |
Source: Public Records
Mortgage History
| Date | Status | Borrower | Loan Amount |
|---|---|---|---|
| Previous Owner | Cortes David | $240,000 | |
| Previous Owner | Cortes David | $145,650 | |
| Previous Owner | Cortes David | $67,350 |
Source: Public Records
Tax History Compared to Growth
Tax History
| Year | Tax Paid | Tax Assessment Tax Assessment Total Assessment is a certain percentage of the fair market value that is determined by local assessors to be the total taxable value of land and additions on the property. | Land | Improvement |
|---|---|---|---|---|
| 2024 | $6,163 | $387,600 | $123,500 | $264,100 |
| 2023 | $5,722 | $313,900 | $98,800 | $215,100 |
| 2022 | $5,672 | $313,900 | $98,800 | $215,100 |
| 2021 | $4,605 | $198,300 | $62,600 | $135,700 |
| 2020 | $4,465 | $197,500 | $62,600 | $134,900 |
| 2019 | $4,298 | $197,500 | $62,600 | $134,900 |
| 2018 | $4,189 | $197,500 | $62,600 | $134,900 |
| 2017 | $3,391 | $131,500 | $55,700 | $75,800 |
| 2016 | $3,297 | $131,500 | $55,700 | $75,800 |
| 2015 | $3,226 | $131,500 | $55,700 | $75,800 |
| 2014 | $3,163 | $131,500 | $55,700 | $75,800 |
Source: Public Records
Map
Nearby Homes
- 8 Buck St Unit 10
- 5 Mulberry St
- 38 Central St
- 22 Wilder St
- 121 Palm St
- 30 Ledge St
- 24 E Otterson St
- 4 Badger St
- 15 Lovell St Unit 20
- 15 Lovell St Unit 3
- 15 Lovell St Unit 7
- 15 Lovell St Unit 10
- 18 Harbor Ave Unit 208
- 2 Lyons St
- 169A W Hollis St Unit 193
- 11 Charles St
- 13 Mulvanity St
- 65 Allds St
- 1 Circle Ave
- 97 Linwood St
- 82 Chestnut St
- 32 Mulberry St
- 36 Mulberry St Unit 38
- 36 Mulberry St Unit C
- 36 Mulberry St Unit 36 C Mulberry Street
- 101 Walnut St Unit 103
- 84 Chestnut St
- 101-103 Walnut St
- 29-31 Mulberry St
- 29 Mulberry St Unit 31
- 29 Mulberry St Unit B
- 76 Chestnut St
- 30 Mulberry St
- 83 Chestnut St
- 81 Chestnut St
- 81 1/2 Chestnut St
- 25 Kinsley St
- 97 Walnut St
- 79 Chestnut St
- 104 Walnut St