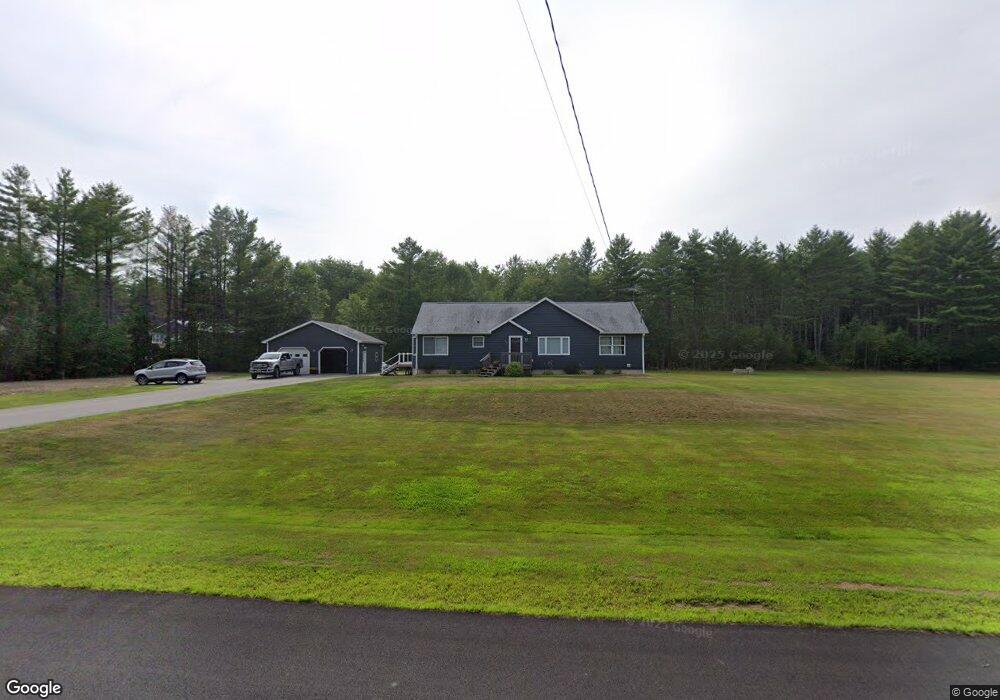
34 Peck Dr Newport, ME 04953
Estimated Value: $364,000 - $466,000
3
Beds
2
Baths
1,592
Sq Ft
$251/Sq Ft
Est. Value
About This Home
This home is located at 34 Peck Dr, Newport, ME 04953 and is currently estimated at $398,898, approximately $250 per square foot. 34 Peck Dr is a home located in Penobscot County with nearby schools including Sebasticook Valley Elementary School and Nokomis Regional Middle School/High School.
Ownership History
Date
Name
Owned For
Owner Type
Purchase Details
Closed on
Oct 27, 2011
Sold by
Savage Richard P
Bought by
Savage Richard P and Savage Denise L
Current Estimated Value
Home Financials for this Owner
Home Financials are based on the most recent Mortgage that was taken out on this home.
Original Mortgage
$139,500
Outstanding Balance
$95,538
Interest Rate
4.11%
Mortgage Type
Purchase Money Mortgage
Estimated Equity
$303,360
Purchase Details
Closed on
Oct 2, 2008
Sold by
Patten & Patten Llc
Bought by
Savage Richard P
Home Financials for this Owner
Home Financials are based on the most recent Mortgage that was taken out on this home.
Original Mortgage
$143,858
Interest Rate
6.54%
Mortgage Type
Unknown
Create a Home Valuation Report for This Property
The Home Valuation Report is an in-depth analysis detailing your home's value as well as a comparison with similar homes in the area
Home Values in the Area
Average Home Value in this Area
Purchase History
| Date | Buyer | Sale Price | Title Company |
|---|---|---|---|
| Savage Richard P | -- | -- | |
| Savage Richard P | -- | -- |
Source: Public Records
Mortgage History
| Date | Status | Borrower | Loan Amount |
|---|---|---|---|
| Open | Savage Richard P | $139,500 | |
| Closed | Savage Richard P | $143,858 |
Source: Public Records
Tax History Compared to Growth
Tax History
| Year | Tax Paid | Tax Assessment Tax Assessment Total Assessment is a certain percentage of the fair market value that is determined by local assessors to be the total taxable value of land and additions on the property. | Land | Improvement |
|---|---|---|---|---|
| 2024 | $4,842 | $276,700 | $41,600 | $235,100 |
| 2023 | $4,003 | $245,600 | $38,800 | $206,800 |
| 2022 | $3,804 | $194,100 | $30,700 | $163,400 |
| 2021 | $3,821 | $185,500 | $29,300 | $156,200 |
| 2020 | $3,751 | $182,100 | $28,800 | $153,300 |
| 2019 | $3,659 | $171,800 | $27,200 | $144,600 |
| 2018 | $3,659 | $171,800 | $27,200 | $144,600 |
| 2017 | $4,655 | $171,800 | $27,200 | $144,600 |
| 2016 | $3,333 | $171,800 | $27,200 | $144,600 |
| 2015 | $3,075 | $171,800 | $27,200 | $144,600 |
| 2014 | -- | $173,200 | $27,200 | $146,000 |
Source: Public Records
Map
Nearby Homes