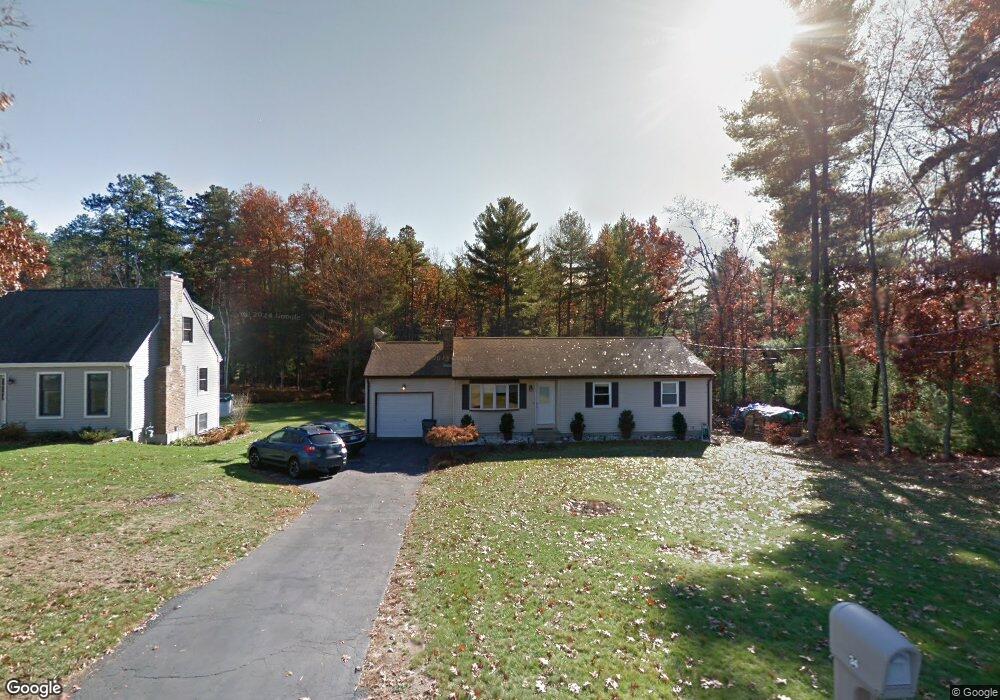
34 Plain St Easthampton, MA 01027
Estimated Value: $379,000 - $402,000
3
Beds
1
Bath
1,142
Sq Ft
$343/Sq Ft
Est. Value
About This Home
This home is located at 34 Plain St, Easthampton, MA 01027 and is currently estimated at $391,237, approximately $342 per square foot. 34 Plain St is a home located in Hampshire County with nearby schools including Easthampton High School, Calvary Baptist Christian School, and Tri-County Schools.
Ownership History
Date
Name
Owned For
Owner Type
Purchase Details
Closed on
Sep 30, 2004
Sold by
Keighley William D
Bought by
Strong Eben P and Collins Sherri M
Current Estimated Value
Home Financials for this Owner
Home Financials are based on the most recent Mortgage that was taken out on this home.
Original Mortgage
$175,750
Outstanding Balance
$86,051
Interest Rate
5.81%
Mortgage Type
Purchase Money Mortgage
Estimated Equity
$305,186
Create a Home Valuation Report for This Property
The Home Valuation Report is an in-depth analysis detailing your home's value as well as a comparison with similar homes in the area
Home Values in the Area
Average Home Value in this Area
Purchase History
| Date | Buyer | Sale Price | Title Company |
|---|---|---|---|
| Strong Eben P | $185,000 | -- |
Source: Public Records
Mortgage History
| Date | Status | Borrower | Loan Amount |
|---|---|---|---|
| Open | Strong Eben P | $175,750 |
Source: Public Records
Tax History
| Year | Tax Paid | Tax Assessment Tax Assessment Total Assessment is a certain percentage of the fair market value that is determined by local assessors to be the total taxable value of land and additions on the property. | Land | Improvement |
|---|---|---|---|---|
| 2025 | $4,515 | $330,300 | $111,000 | $219,300 |
| 2024 | $4,360 | $321,500 | $107,800 | $213,700 |
| 2023 | $3,323 | $226,800 | $85,600 | $141,200 |
| 2022 | $3,749 | $226,800 | $85,600 | $141,200 |
| 2021 | $4,101 | $233,800 | $85,600 | $148,200 |
| 2020 | $4,028 | $226,800 | $85,600 | $141,200 |
| 2019 | $3,376 | $218,400 | $85,600 | $132,800 |
| 2018 | $3,240 | $202,500 | $80,800 | $121,700 |
| 2017 | $3,161 | $195,000 | $77,500 | $117,500 |
| 2016 | $3,040 | $195,000 | $77,500 | $117,500 |
| 2015 | $2,954 | $195,000 | $77,500 | $117,500 |
Source: Public Records
Map
Nearby Homes
Your Personal Tour Guide
Ask me questions while you tour the home.