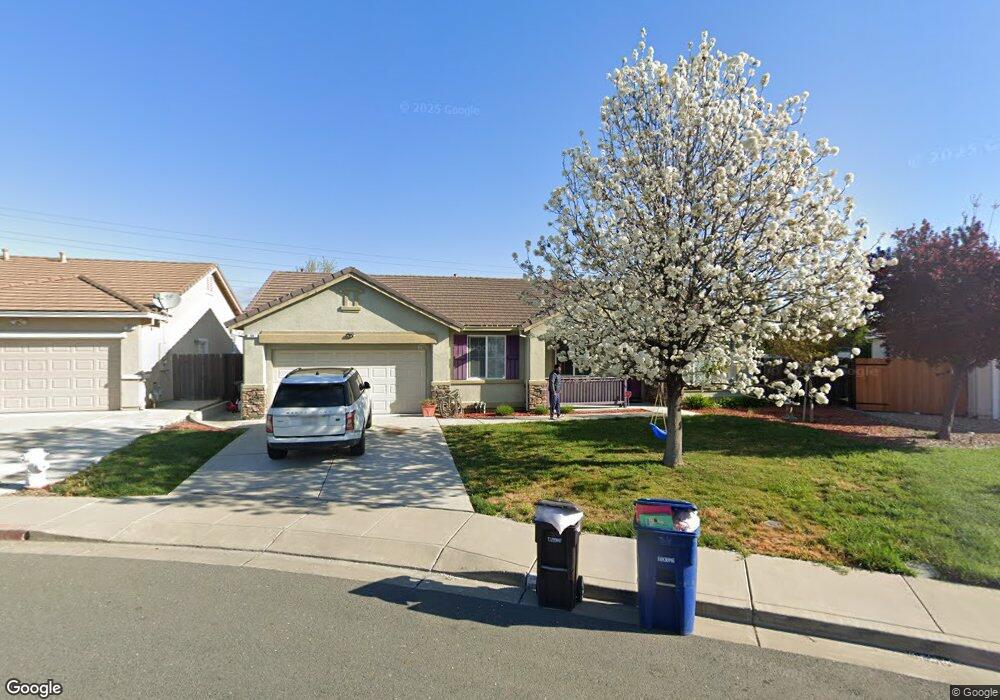
34 Plum Tree Ct Pittsburg, CA 94565
Contra Loma NeighborhoodEstimated Value: $618,751 - $754,000
3
Beds
2
Baths
1,734
Sq Ft
$395/Sq Ft
Est. Value
About This Home
This home is located at 34 Plum Tree Ct, Pittsburg, CA 94565 and is currently estimated at $684,188, approximately $394 per square foot. 34 Plum Tree Ct is a home located in Contra Costa County with nearby schools including Foothill Elementary School, Hillview Junior High School, and Pittsburg Senior High School.
Ownership History
Date
Name
Owned For
Owner Type
Purchase Details
Closed on
Mar 27, 2023
Sold by
Dintakurty Satyanarayana and Dintakurty Sudharani
Bought by
Sasu Conjugal Family Trust
Current Estimated Value
Purchase Details
Closed on
Dec 6, 2018
Sold by
Separate Conway Jacob Michael
Bought by
Dintakurty Satyanarayana and Dintakurty Sudharani
Home Financials for this Owner
Home Financials are based on the most recent Mortgage that was taken out on this home.
Original Mortgage
$367,500
Interest Rate
4.8%
Mortgage Type
New Conventional
Purchase Details
Closed on
Jan 3, 2017
Sold by
Conway Jacob M
Bought by
Conway Jacob Michael
Purchase Details
Closed on
Jan 12, 2010
Sold by
West Coast Home Builders Inc
Bought by
Conway Jacob M
Home Financials for this Owner
Home Financials are based on the most recent Mortgage that was taken out on this home.
Original Mortgage
$218,400
Interest Rate
4.78%
Mortgage Type
Purchase Money Mortgage
Create a Home Valuation Report for This Property
The Home Valuation Report is an in-depth analysis detailing your home's value as well as a comparison with similar homes in the area
Home Values in the Area
Average Home Value in this Area
Purchase History
| Date | Buyer | Sale Price | Title Company |
|---|---|---|---|
| Sasu Conjugal Family Trust | -- | None Listed On Document | |
| Dintakurty Satyanarayana | -- | None Listed On Document | |
| Dintakurty Satyanarayana | $491,000 | Stewart Title Of California | |
| Conway Jacob Michael | -- | None Available | |
| Conway Jacob M | $273,000 | Old Republic Title Company |
Source: Public Records
Mortgage History
| Date | Status | Borrower | Loan Amount |
|---|---|---|---|
| Previous Owner | Dintakurty Satyanarayana | $367,500 | |
| Previous Owner | Conway Jacob M | $218,400 |
Source: Public Records
Tax History
| Year | Tax Paid | Tax Assessment Tax Assessment Total Assessment is a certain percentage of the fair market value that is determined by local assessors to be the total taxable value of land and additions on the property. | Land | Improvement |
|---|---|---|---|---|
| 2025 | $6,961 | $547,381 | $233,364 | $314,017 |
| 2024 | $6,620 | $536,649 | $228,789 | $307,860 |
| 2023 | $6,620 | $526,127 | $224,303 | $301,824 |
| 2022 | $6,725 | $515,811 | $219,905 | $295,906 |
| 2021 | $6,741 | $505,698 | $215,594 | $290,104 |
| 2019 | $6,438 | $490,700 | $209,200 | $281,500 |
| 2018 | $4,136 | $309,701 | $62,392 | $247,309 |
| 2017 | $4,109 | $303,629 | $61,169 | $242,460 |
| 2016 | $3,839 | $297,676 | $59,970 | $237,706 |
| 2015 | $3,992 | $293,206 | $59,070 | $234,136 |
| 2014 | $3,867 | $287,463 | $57,913 | $229,550 |
Source: Public Records
Map
Nearby Homes
- 1631 Limewood Place
- 1426 Cobblestone Dr
- 1602 Ashwood Dr
- 4350 Palo Verde Dr
- 1871 Ventura Dr
- 1194 Ventura Dr
- 1169 Park West Dr
- 4221 Mcdermott Dr
- 1248 Metten Ave
- 4068 Barn Hollow Way
- 4175 Stephanie Way
- 38 Meadowbrook Ave
- 61 Pali Way
- 77 Hilo Dr
- 61 Meadowbrook Cir
- 65 Pali Way
- 222 Piedmont Ln
- 4310 Foothill Way
- 2131 Lakeview Cir
- 109 Reef Dr Unit 109
- 30 Plum Tree Ct
- 38 Plum Tree Ct
- 26 Plum Tree Ct
- 58 Plum Tree Ct
- 42 Plum Tree Ct
- 62 Plum Tree Ct
- 22 Plum Tree Ct
- 46 Plum Tree Ct
- 54 Plum Tree Ct
- 50 Plum Tree Ct
- 66 Plum Tree Ct
- 18 Plum Tree Ct
- 17 Plum Tree Ln
- 1555 Ventura Dr
- 15 Plum Tree Ln
- 14 Plum Tree Ct
- 1522 Norine Dr
- 70 Plum Tree Ct
- 11 Plum Tree Ln
- 1535 Ventura Dr
Your Personal Tour Guide
Ask me questions while you tour the home.