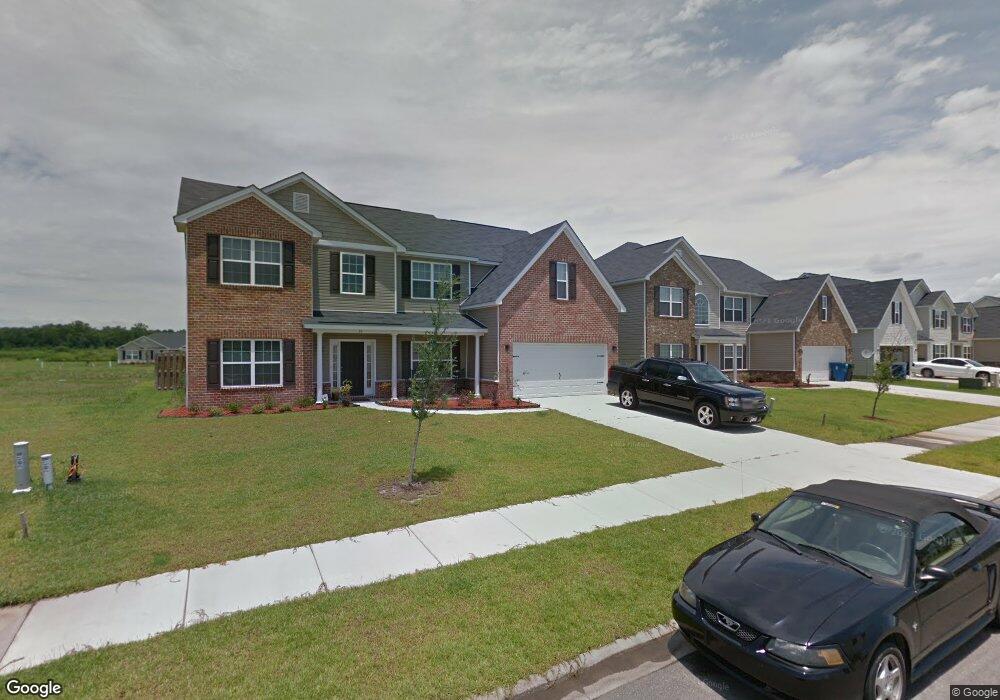
34 Rice Creek Rd Savannah, GA 31407
Estimated Value: $379,000 - $428,000
3
Beds
3
Baths
3,594
Sq Ft
$109/Sq Ft
Est. Value
About This Home
This home is located at 34 Rice Creek Rd, Savannah, GA 31407 and is currently estimated at $393,374, approximately $109 per square foot. 34 Rice Creek Rd is a home located in Chatham County with nearby schools including Rice Creek K-8 School and Groves High School.
Ownership History
Date
Name
Owned For
Owner Type
Purchase Details
Closed on
Oct 7, 2025
Sold by
Simmons Brianna David
Bought by
Furman Gernie L and Furman Martha
Current Estimated Value
Home Financials for this Owner
Home Financials are based on the most recent Mortgage that was taken out on this home.
Original Mortgage
$386,548
Outstanding Balance
$386,188
Interest Rate
6.35%
Mortgage Type
New Conventional
Estimated Equity
$7,186
Purchase Details
Closed on
Sep 30, 2020
Sold by
Worthy Torrence A
Bought by
Simmons Michael Scott and Simmons Brianna David
Home Financials for this Owner
Home Financials are based on the most recent Mortgage that was taken out on this home.
Original Mortgage
$276,210
Interest Rate
2.9%
Mortgage Type
VA
Purchase Details
Closed on
Oct 6, 2010
Sold by
Lamar Smith Signature Homes
Bought by
Worthy Torrence A
Home Financials for this Owner
Home Financials are based on the most recent Mortgage that was taken out on this home.
Original Mortgage
$253,085
Interest Rate
4.39%
Mortgage Type
VA
Purchase Details
Closed on
Mar 7, 2008
Sold by
Not Provided
Bought by
Worthy Torrence A
Create a Home Valuation Report for This Property
The Home Valuation Report is an in-depth analysis detailing your home's value as well as a comparison with similar homes in the area
Home Values in the Area
Average Home Value in this Area
Purchase History
| Date | Buyer | Sale Price | Title Company |
|---|---|---|---|
| Furman Gernie L | $379,900 | -- | |
| Simmons Michael Scott | $270,000 | -- | |
| Worthy Torrence A | $247,200 | -- | |
| Worthy Torrence A | $247,200 | -- | |
| Worthy Torrence A | $252,900 | -- |
Source: Public Records
Mortgage History
| Date | Status | Borrower | Loan Amount |
|---|---|---|---|
| Open | Furman Gernie L | $386,548 | |
| Previous Owner | Simmons Michael Scott | $276,210 | |
| Previous Owner | Worthy Torrence A | $253,085 |
Source: Public Records
Tax History Compared to Growth
Tax History
| Year | Tax Paid | Tax Assessment Tax Assessment Total Assessment is a certain percentage of the fair market value that is determined by local assessors to be the total taxable value of land and additions on the property. | Land | Improvement |
|---|---|---|---|---|
| 2025 | $5,889 | $166,560 | $30,000 | $136,560 |
| 2024 | $5,889 | $162,880 | $26,000 | $136,880 |
| 2023 | $4,932 | $152,640 | $20,000 | $132,640 |
| 2022 | $3,489 | $118,720 | $14,000 | $104,720 |
| 2021 | $3,664 | $103,120 | $14,000 | $89,120 |
| 2020 | $3,107 | $100,560 | $14,000 | $86,560 |
| 2019 | $3,106 | $98,840 | $12,000 | $86,840 |
| 2018 | $2,671 | $95,440 | $12,000 | $83,440 |
| 2017 | $2,646 | $87,600 | $12,600 | $75,000 |
| 2016 | $2,646 | $86,040 | $12,600 | $73,440 |
| 2015 | $2,679 | $86,920 | $12,600 | $74,320 |
| 2014 | $4,085 | $88,080 | $0 | $0 |
Source: Public Records
Map
Nearby Homes
- 17 Sea Oats Dr
- 109 Miller Park Cir
- 87 Marsh Salt Ln
- Dayton Plan at Brookline
- Spring Valley II Plan at Brookline
- Stillwater Plan at Brookline
- Grayson TR Plan at Rice Creek
- Richmond Plan at Brookline
- Spring Garden TR Plan at Rice Creek
- Crestview Plan at Brookline
- Spring Valley II TR Plan at Rice Creek
- Bismarck II TR Plan at Rice Creek
- Blue Ridge TR Plan at Rice Creek
- Crestview TR Plan at Rice Creek
- Pinehurst II Plan at Brookline
- Avery Plan at Brookline
- Brookline Plan at Brookline
- 106 Marsh Salt Ln
- 84 Marsh Salt Ln
- 93 Marsh Salt Ln
- 32 Rice Creek Rd
- 32 Rice Creek Rd
- 36 Rice Creek Rd
- 36 Rice Creek Rd
- 11 Heritage Rd
- 13 Heritage Rd
- 30 Rice Creek Rd
- 30 Rice Creek Rd
- 9 Heritage Rd
- 15 Heritage Rd
- 2 Fitzwater Rd
- 2 Fitzwater Rd
- 7 Heritage Rd
- 116 Miller Park Cir
- 28 Rice Creek Rd
- 28 Rice Creek Rd
- 5 Heritage Rd
- 5 Heritage Woods
- 5 Heritage Woods Unit 5
- 4 Fitzwater Rd