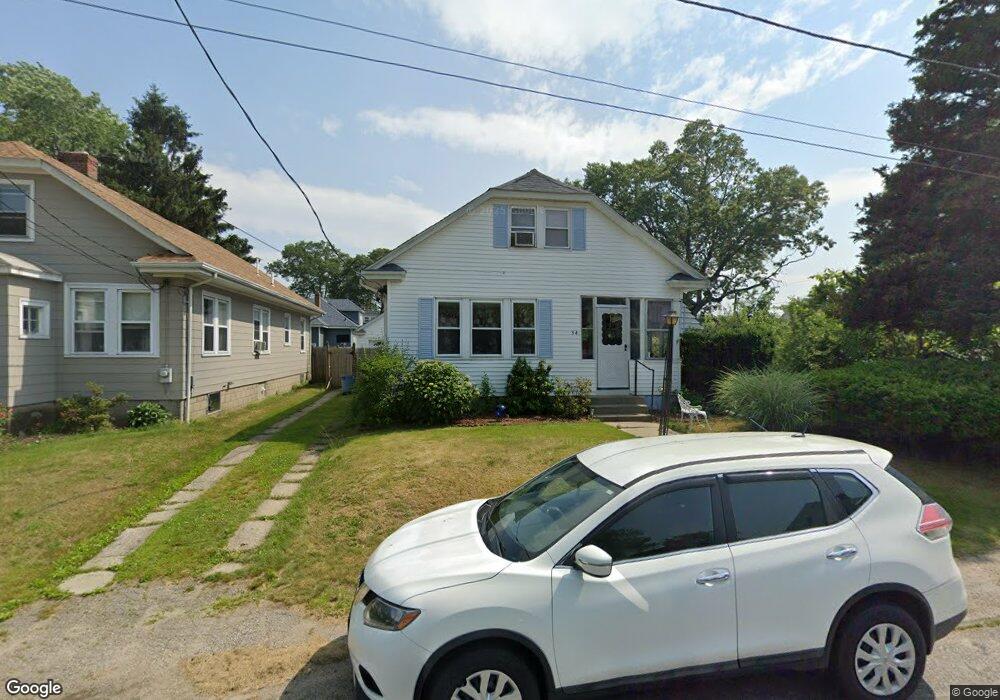
34 Ruxton St Cranston, RI 02910
Auburn NeighborhoodEstimated Value: $379,000 - $442,000
3
Beds
2
Baths
1,393
Sq Ft
$289/Sq Ft
Est. Value
About This Home
This home is located at 34 Ruxton St, Cranston, RI 02910 and is currently estimated at $402,296, approximately $288 per square foot. 34 Ruxton St is a home located in Providence County with nearby schools including Eden Park Elementary School, Park View Middle School, and Cranston High School East.
Ownership History
Date
Name
Owned For
Owner Type
Purchase Details
Closed on
Apr 8, 2022
Sold by
Lacroix Cheryl A
Bought by
Lacroix Cheryl A and Lacroix Aaron
Current Estimated Value
Home Financials for this Owner
Home Financials are based on the most recent Mortgage that was taken out on this home.
Original Mortgage
$139,366
Outstanding Balance
$129,400
Interest Rate
3.85%
Mortgage Type
New Conventional
Estimated Equity
$272,896
Purchase Details
Closed on
Nov 18, 2015
Sold by
Lacroix Ronald E and Lacroix Carol A
Bought by
Lacroix Ronald E and Lacroix Carol A
Home Financials for this Owner
Home Financials are based on the most recent Mortgage that was taken out on this home.
Original Mortgage
$122,812
Interest Rate
3.87%
Mortgage Type
FHA
Create a Home Valuation Report for This Property
The Home Valuation Report is an in-depth analysis detailing your home's value as well as a comparison with similar homes in the area
Home Values in the Area
Average Home Value in this Area
Purchase History
| Date | Buyer | Sale Price | Title Company |
|---|---|---|---|
| Lacroix Cheryl A | -- | None Available | |
| Lacroix Cheryl A | -- | None Available | |
| Lacroix Ronald E | -- | -- | |
| Lacroix Ronald E | -- | -- |
Source: Public Records
Mortgage History
| Date | Status | Borrower | Loan Amount |
|---|---|---|---|
| Open | Lacroix Cheryl A | $139,366 | |
| Closed | Lacroix Cheryl A | $139,366 | |
| Previous Owner | Lacroix Ronald E | $122,812 |
Source: Public Records
Tax History
| Year | Tax Paid | Tax Assessment Tax Assessment Total Assessment is a certain percentage of the fair market value that is determined by local assessors to be the total taxable value of land and additions on the property. | Land | Improvement |
|---|---|---|---|---|
| 2025 | $4,243 | $305,700 | $94,300 | $211,400 |
| 2024 | $4,161 | $305,700 | $94,300 | $211,400 |
| 2023 | $3,890 | $205,800 | $65,100 | $140,700 |
| 2022 | $3,809 | $205,800 | $65,100 | $140,700 |
| 2021 | $3,704 | $205,800 | $65,100 | $140,700 |
| 2020 | $3,591 | $172,900 | $61,800 | $111,100 |
| 2019 | $3,591 | $172,900 | $61,800 | $111,100 |
| 2018 | $3,508 | $172,900 | $61,800 | $111,100 |
| 2017 | $3,058 | $133,300 | $45,500 | $87,800 |
| 2016 | $2,993 | $133,300 | $45,500 | $87,800 |
| 2015 | $2,993 | $133,300 | $45,500 | $87,800 |
| 2014 | $2,928 | $128,200 | $45,500 | $82,700 |
Source: Public Records
Map
Nearby Homes
- 55 Melrose St
- 363 Pontiac Ave
- 36 Blackamore Ave
- 11 Griswold Ave
- 288 Pontiac Ave
- 140 Eldridge St
- 181 Grace St
- 77 Victory St
- 326 Beckwith St
- 80 Colonial Ave
- 113 Caporal St
- 90 Garden St
- 144 Laurens St
- 124 Clarence St
- 41 Cottage St
- 152 Woodbine St
- 41 Gleason St
- 183 Midwood St
- 46 Roslyn Ave
- 43 Woodbine St
Your Personal Tour Guide
Ask me questions while you tour the home.