Estimated Value: $820,000 - $983,229
--
Bed
--
Bath
7,808
Sq Ft
$115/Sq Ft
Est. Value
About This Home
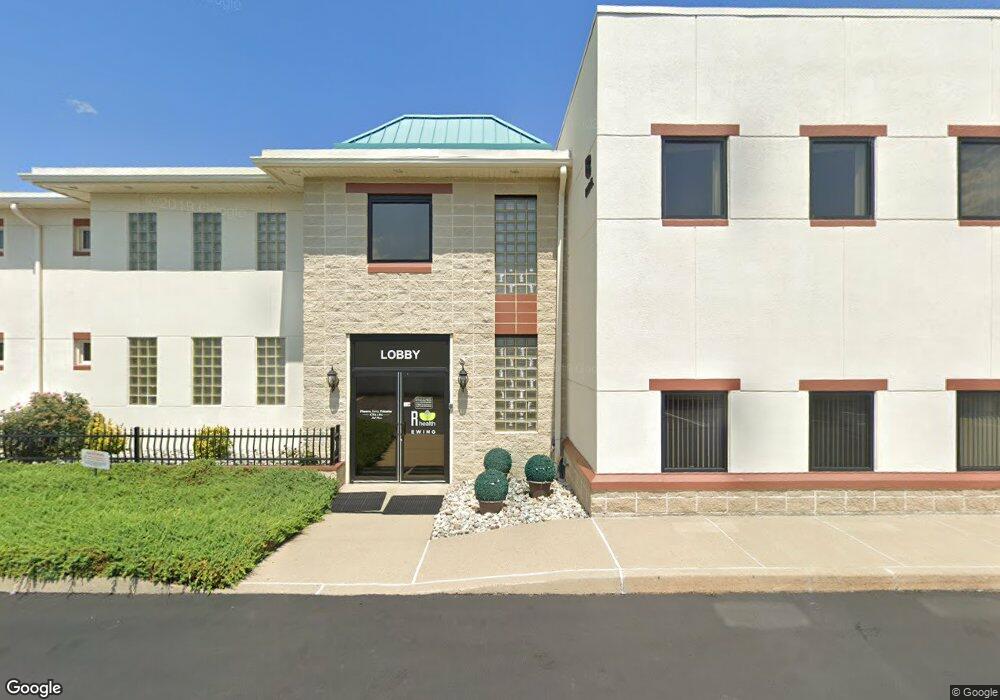
This home is located at 34 Scotch Rd, Ewing, NJ 08628 and is currently estimated at $901,615, approximately $115 per square foot. 34 Scotch Rd is a home located in Mercer County with nearby schools including Ewing High School, The Village Charter School, and Trenton Stem-To-Civics Charter School.
Ownership History
Date
Name
Owned For
Owner Type
Purchase Details
Closed on
Feb 17, 1996
Sold by
Burroughs Charles
Bought by
Scotch Rd Asso L L C
Current Estimated Value
Home Financials for this Owner
Home Financials are based on the most recent Mortgage that was taken out on this home.
Original Mortgage
$196,000
Outstanding Balance
$6,433
Interest Rate
7.04%
Mortgage Type
Commercial
Estimated Equity
$895,182
Create a Home Valuation Report for This Property
The Home Valuation Report is an in-depth analysis detailing your home's value as well as a comparison with similar homes in the area
Home Values in the Area
Average Home Value in this Area
Purchase History
| Date | Buyer | Sale Price | Title Company |
|---|---|---|---|
| Scotch Rd Asso L L C | $245,000 | -- |
Source: Public Records
Mortgage History
| Date | Status | Borrower | Loan Amount |
|---|---|---|---|
| Open | Scotch Rd Asso L L C | $196,000 |
Source: Public Records
Tax History Compared to Growth
Tax History
| Year | Tax Paid | Tax Assessment Tax Assessment Total Assessment is a certain percentage of the fair market value that is determined by local assessors to be the total taxable value of land and additions on the property. | Land | Improvement |
|---|---|---|---|---|
| 2025 | $32,565 | $828,000 | $105,000 | $723,000 |
| 2024 | $30,611 | $828,000 | $105,000 | $723,000 |
| 2023 | $30,611 | $828,000 | $105,000 | $723,000 |
| 2022 | $29,783 | $828,000 | $105,000 | $723,000 |
| 2021 | $29,055 | $828,000 | $105,000 | $723,000 |
| 2020 | $28,641 | $828,000 | $105,000 | $723,000 |
| 2019 | $27,895 | $828,000 | $105,000 | $723,000 |
| 2018 | $28,132 | $532,600 | $78,800 | $453,800 |
| 2017 | $28,787 | $532,600 | $78,800 | $453,800 |
| 2016 | $28,398 | $532,600 | $78,800 | $453,800 |
| 2015 | $28,020 | $532,600 | $78,800 | $453,800 |
| 2014 | $27,946 | $532,600 | $78,800 | $453,800 |
Source: Public Records
Map
Nearby Homes