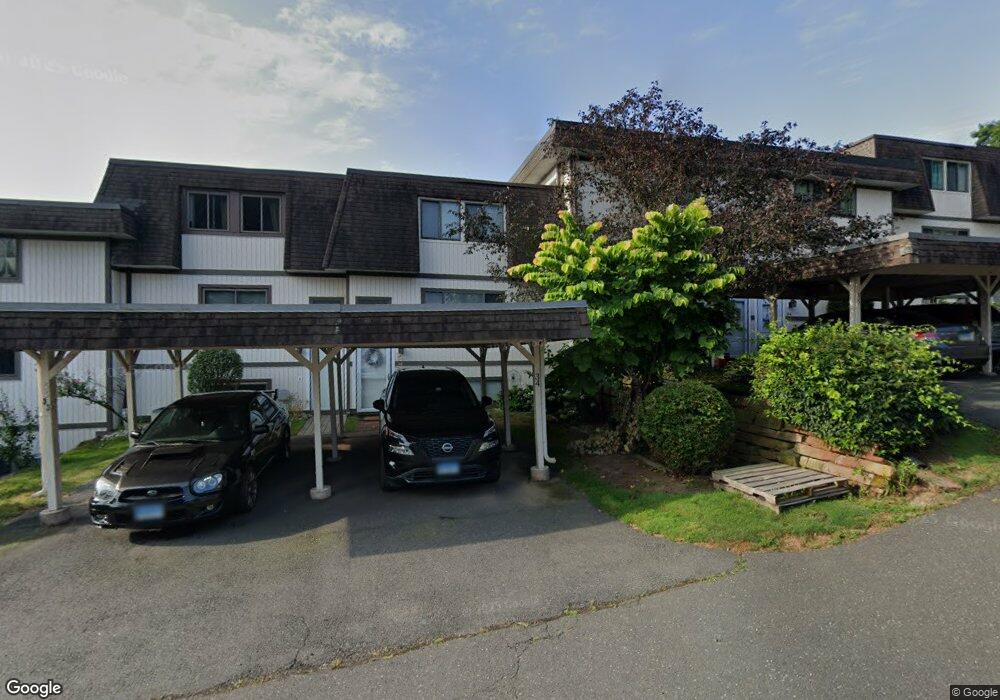
34 Shad Row Suffield, CT 06078
Estimated Value: $254,609 - $271,000
3
Beds
3
Baths
1,276
Sq Ft
$205/Sq Ft
Est. Value
About This Home
This home is located at 34 Shad Row, Suffield, CT 06078 and is currently estimated at $261,652, approximately $205 per square foot. 34 Shad Row is a home located in Hartford County with nearby schools including A. Ward Spaulding School, Mcalister Intermediate School, and Suffield Middle School.
Ownership History
Date
Name
Owned For
Owner Type
Purchase Details
Closed on
Jun 29, 2009
Sold by
Nca Properties Llc
Bought by
Torres Jennifer
Current Estimated Value
Home Financials for this Owner
Home Financials are based on the most recent Mortgage that was taken out on this home.
Original Mortgage
$161,397
Interest Rate
4.92%
Purchase Details
Closed on
Jul 31, 2001
Sold by
Helmick Christine
Bought by
Forni Alexander and Bernard Mary
Purchase Details
Closed on
Nov 7, 1991
Sold by
Parkis David and Parkis Shirley
Bought by
The Money Store
Create a Home Valuation Report for This Property
The Home Valuation Report is an in-depth analysis detailing your home's value as well as a comparison with similar homes in the area
Home Values in the Area
Average Home Value in this Area
Purchase History
| Date | Buyer | Sale Price | Title Company |
|---|---|---|---|
| Torres Jennifer | $158,000 | -- | |
| Forni Alexander | $94,500 | -- | |
| The Money Store | $63,500 | -- |
Source: Public Records
Mortgage History
| Date | Status | Borrower | Loan Amount |
|---|---|---|---|
| Open | The Money Store | $156,428 | |
| Closed | The Money Store | $161,397 |
Source: Public Records
Tax History
| Year | Tax Paid | Tax Assessment Tax Assessment Total Assessment is a certain percentage of the fair market value that is determined by local assessors to be the total taxable value of land and additions on the property. | Land | Improvement |
|---|---|---|---|---|
| 2025 | $3,490 | $149,100 | $0 | $149,100 |
| 2024 | $3,374 | $149,100 | $0 | $149,100 |
| 2023 | $2,553 | $89,250 | $0 | $89,250 |
| 2022 | $2,553 | $89,250 | $0 | $89,250 |
| 2021 | $2,556 | $89,250 | $0 | $89,250 |
| 2020 | $2,556 | $89,250 | $0 | $89,250 |
| 2019 | $2,563 | $89,250 | $0 | $89,250 |
| 2018 | $2,451 | $83,580 | $0 | $83,580 |
| 2017 | $2,475 | $85,680 | $0 | $85,680 |
| 2016 | $2,416 | $85,680 | $0 | $85,680 |
| 2015 | $2,380 | $85,680 | $0 | $85,680 |
| 2014 | $2,324 | $85,680 | $0 | $85,680 |
Source: Public Records
Map
Nearby Homes
- 34 Shad Row Unit U34
- 32 Shad Row
- 99 Spring Ln
- 97 Spring Ln
- 95 Spring Ln
- 93 Spring Ln
- 95 Spring Ln Unit 95
- 38 Shad Row
- 38 Shad Row Unit 38
- 40 Shad Row
- 40 Shad Row Unit 40
- 42 Shad Row
- 42 Shad Row Unit 42
- 33 Shad Row
- 43 Shad Row
- 43 Shad Row Unit 43
- 41 Shad Row
- 41 Shad Row Unit 41
- 39 Shad Row
- 39 Shad Row Unit 39
Your Personal Tour Guide
Ask me questions while you tour the home.