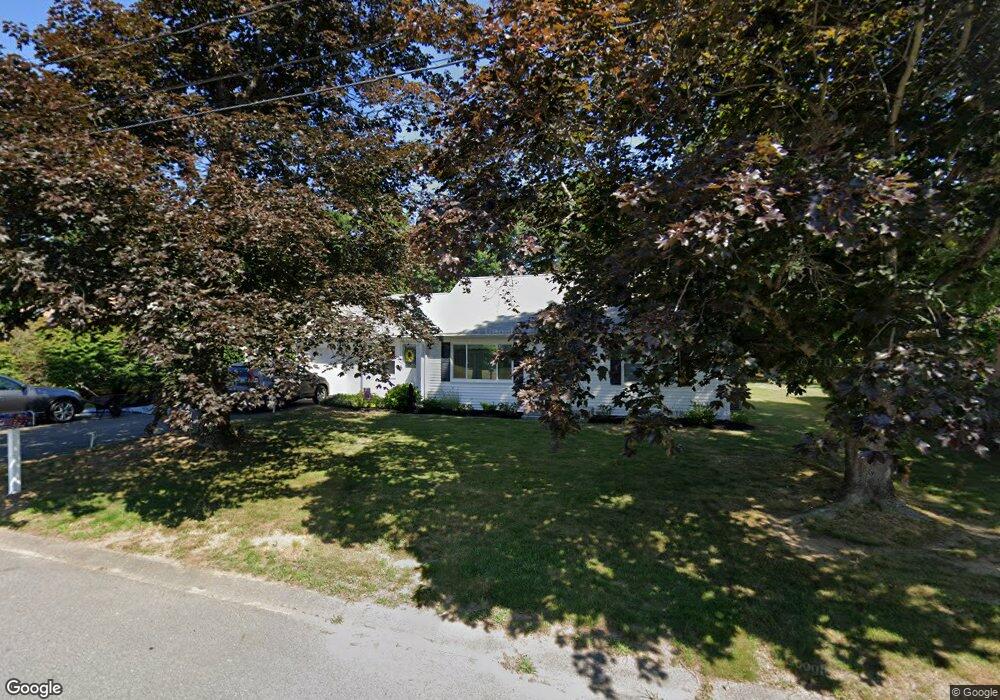
34 Shawnee Ave East Bridgewater, MA 02333
Estimated Value: $462,973 - $535,000
2
Beds
1
Bath
918
Sq Ft
$540/Sq Ft
Est. Value
About This Home
This home is located at 34 Shawnee Ave, East Bridgewater, MA 02333 and is currently estimated at $495,993, approximately $540 per square foot. 34 Shawnee Ave is a home located in Plymouth County with nearby schools including Gordon W Mitchell Middle School, East Bridgewater Jr./Sr. High School, and New Heights Charter School.
Ownership History
Date
Name
Owned For
Owner Type
Purchase Details
Closed on
Jun 6, 2025
Sold by
Randle Martine
Bought by
Randle Martine and Devico David C
Current Estimated Value
Purchase Details
Closed on
Aug 30, 1991
Sold by
Turner Mabel L
Bought by
Randle Clarence and Randle Martine
Home Financials for this Owner
Home Financials are based on the most recent Mortgage that was taken out on this home.
Original Mortgage
$100,000
Interest Rate
9.44%
Mortgage Type
Purchase Money Mortgage
Create a Home Valuation Report for This Property
The Home Valuation Report is an in-depth analysis detailing your home's value as well as a comparison with similar homes in the area
Home Values in the Area
Average Home Value in this Area
Purchase History
| Date | Buyer | Sale Price | Title Company |
|---|---|---|---|
| Randle Martine | -- | None Available | |
| Randle Martine | -- | None Available | |
| Randle Clarence | $125,000 | -- |
Source: Public Records
Mortgage History
| Date | Status | Borrower | Loan Amount |
|---|---|---|---|
| Previous Owner | Randle Clarence | $90,000 | |
| Previous Owner | Randle Clarence | $100,000 |
Source: Public Records
Tax History Compared to Growth
Tax History
| Year | Tax Paid | Tax Assessment Tax Assessment Total Assessment is a certain percentage of the fair market value that is determined by local assessors to be the total taxable value of land and additions on the property. | Land | Improvement |
|---|---|---|---|---|
| 2025 | $5,640 | $412,600 | $176,800 | $235,800 |
| 2024 | $5,493 | $396,900 | $170,000 | $226,900 |
| 2023 | $5,407 | $374,200 | $170,000 | $204,200 |
| 2022 | $5,343 | $342,500 | $154,700 | $187,800 |
| 2021 | $5,149 | $302,000 | $148,600 | $153,400 |
| 2020 | $9,429 | $290,400 | $142,900 | $147,500 |
| 2019 | $4,868 | $277,200 | $136,600 | $140,600 |
| 2018 | $5,014 | $255,300 | $136,600 | $118,700 |
| 2017 | $4,452 | $243,300 | $130,200 | $113,100 |
| 2016 | $4,313 | $237,500 | $130,200 | $107,300 |
| 2015 | $4,165 | $234,500 | $129,300 | $105,200 |
| 2014 | $3,999 | $230,200 | $126,600 | $103,600 |
Source: Public Records
Map
Nearby Homes