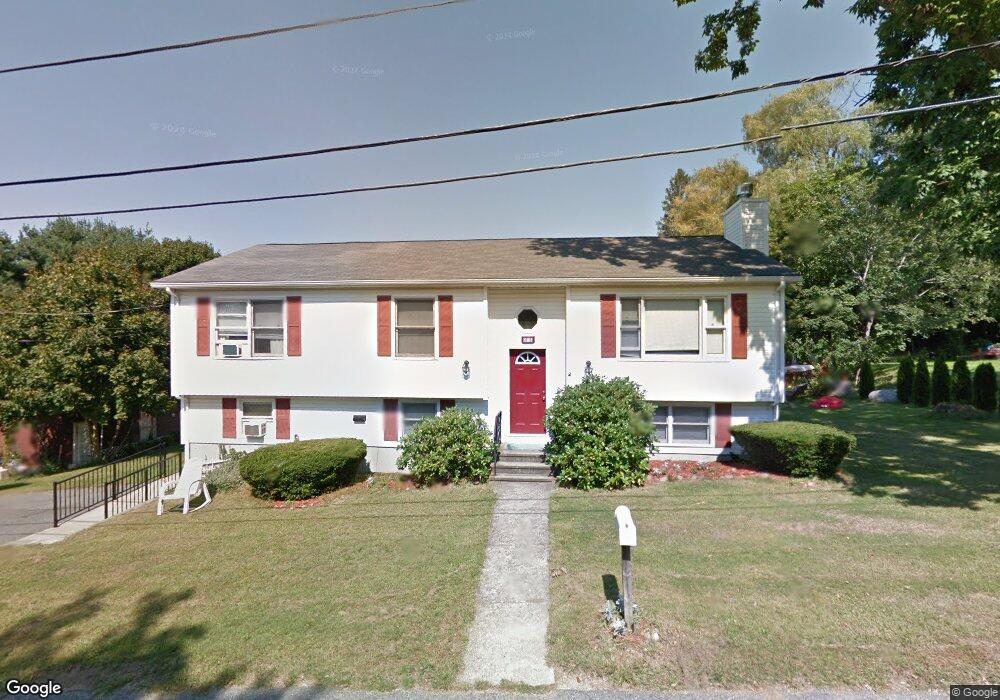
34 Sidney St Fall River, MA 02720
Western Fall River NeighborhoodEstimated Value: $501,000 - $583,000
3
Beds
3
Baths
2,322
Sq Ft
$235/Sq Ft
Est. Value
About This Home
This home is located at 34 Sidney St, Fall River, MA 02720 and is currently estimated at $545,855, approximately $235 per square foot. 34 Sidney St is a home located in Bristol County with nearby schools including North End Elementary School, Morton Middle School, and B M C Durfee High School.
Ownership History
Date
Name
Owned For
Owner Type
Purchase Details
Closed on
Mar 17, 2022
Sold by
Patrico John L and Patrico Elizabeth A
Bought by
Patrico John L and Patrico Elizabeth A
Current Estimated Value
Create a Home Valuation Report for This Property
The Home Valuation Report is an in-depth analysis detailing your home's value as well as a comparison with similar homes in the area
Home Values in the Area
Average Home Value in this Area
Purchase History
| Date | Buyer | Sale Price | Title Company |
|---|---|---|---|
| Patrico John L | -- | None Available |
Source: Public Records
Tax History
| Year | Tax Paid | Tax Assessment Tax Assessment Total Assessment is a certain percentage of the fair market value that is determined by local assessors to be the total taxable value of land and additions on the property. | Land | Improvement |
|---|---|---|---|---|
| 2025 | $5,293 | $462,300 | $119,500 | $342,800 |
| 2024 | $4,747 | $413,100 | $117,100 | $296,000 |
| 2023 | $4,730 | $385,500 | $105,500 | $280,000 |
| 2022 | $4,127 | $330,300 | $99,600 | $230,700 |
| 2021 | $4,127 | $298,400 | $95,100 | $203,300 |
| 2020 | $4,023 | $278,400 | $90,800 | $187,600 |
| 2019 | $3,798 | $260,500 | $94,900 | $165,600 |
| 2018 | $3,635 | $248,600 | $95,600 | $153,000 |
| 2017 | $3,417 | $244,100 | $95,600 | $148,500 |
| 2016 | $3,170 | $232,600 | $98,500 | $134,100 |
| 2015 | $3,100 | $237,000 | $98,500 | $138,500 |
| 2014 | $2,981 | $237,000 | $98,500 | $138,500 |
Source: Public Records
Map
Nearby Homes
- 232 Mount Pleasant St
- 3636 N Main St Unit 5
- 3682 N Main St Unit 6
- 2396 Riverside Ave
- 257 Calvin St
- 1810 Highland Ave Unit 22
- 3753 N Main St Unit 1
- 30 Gray St
- Parcel 2 Highcrest Rd
- 2714 Riverside Ave
- 3896 N Main St
- 318 Crescent St Unit A
- 29 Valentine St
- 72 Ida Ln
- 274 Archer St
- 1553 Riverside Ave
- 200 Crescent St
- 1496 Riverside Ave
- 34 Doherty Ave
- 46 Dias Terrace
Your Personal Tour Guide
Ask me questions while you tour the home.