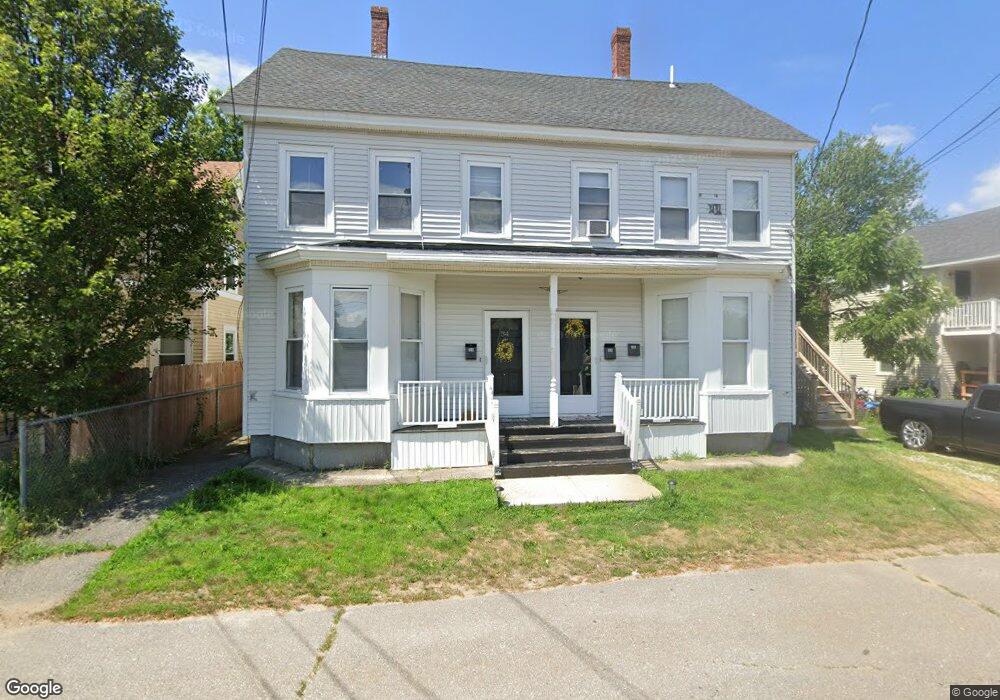
34 Spalding St Unit 36 Nashua, NH 03060
Southeast Nashua NeighborhoodEstimated Value: $589,844 - $679,000
10
Beds
2
Baths
3,004
Sq Ft
$212/Sq Ft
Est. Value
About This Home
This home is located at 34 Spalding St Unit 36, Nashua, NH 03060 and is currently estimated at $638,211, approximately $212 per square foot. 34 Spalding St Unit 36 is a home located in Hillsborough County with nearby schools including Dr. Norman W. Crisp Elementary School, Elm Street Middle School, and Nashua High School North.
Ownership History
Date
Name
Owned For
Owner Type
Purchase Details
Closed on
Sep 10, 2020
Sold by
Avalos Avclino
Bought by
Ponce Alfredo R and Avalos Dora A
Current Estimated Value
Home Financials for this Owner
Home Financials are based on the most recent Mortgage that was taken out on this home.
Original Mortgage
$382,936
Outstanding Balance
$339,830
Interest Rate
2.9%
Mortgage Type
FHA
Estimated Equity
$298,381
Purchase Details
Closed on
Sep 29, 2008
Sold by
Us Bank Na
Bought by
Avalos Avelino
Home Financials for this Owner
Home Financials are based on the most recent Mortgage that was taken out on this home.
Original Mortgage
$224,249
Interest Rate
6.57%
Mortgage Type
Purchase Money Mortgage
Purchase Details
Closed on
Aug 11, 2008
Sold by
Vargas Rubby and Us Bank Na
Bought by
Us Bank Na
Home Financials for this Owner
Home Financials are based on the most recent Mortgage that was taken out on this home.
Original Mortgage
$224,249
Interest Rate
6.57%
Mortgage Type
Purchase Money Mortgage
Purchase Details
Closed on
Nov 16, 2004
Sold by
Daniel J Dumais T
Bought by
Vargas Rubby
Create a Home Valuation Report for This Property
The Home Valuation Report is an in-depth analysis detailing your home's value as well as a comparison with similar homes in the area
Home Values in the Area
Average Home Value in this Area
Purchase History
| Date | Buyer | Sale Price | Title Company |
|---|---|---|---|
| Ponce Alfredo R | $390,000 | None Available | |
| Avalos Avelino | $198,000 | -- | |
| Us Bank Na | $172,500 | -- | |
| Vargas Rubby | $280,000 | -- |
Source: Public Records
Mortgage History
| Date | Status | Borrower | Loan Amount |
|---|---|---|---|
| Open | Ponce Alfredo R | $382,936 | |
| Previous Owner | Vargas Rubby | $226,213 | |
| Previous Owner | Vargas Rubby | $224,249 | |
| Previous Owner | Vargas Rubby | $275,200 | |
| Previous Owner | Vargas Rubby | $68,800 |
Source: Public Records
Tax History Compared to Growth
Tax History
| Year | Tax Paid | Tax Assessment Tax Assessment Total Assessment is a certain percentage of the fair market value that is determined by local assessors to be the total taxable value of land and additions on the property. | Land | Improvement |
|---|---|---|---|---|
| 2024 | $8,530 | $536,500 | $135,100 | $401,400 |
| 2023 | $7,925 | $434,700 | $108,000 | $326,700 |
| 2022 | $7,855 | $434,700 | $108,000 | $326,700 |
| 2021 | $6,490 | $279,500 | $64,800 | $214,700 |
| 2020 | $6,288 | $278,100 | $64,800 | $213,300 |
| 2019 | $6,051 | $278,100 | $64,800 | $213,300 |
| 2018 | $5,899 | $278,100 | $64,800 | $213,300 |
| 2017 | $4,529 | $175,600 | $60,200 | $115,400 |
| 2016 | $4,402 | $175,600 | $60,200 | $115,400 |
| 2015 | $4,307 | $175,600 | $60,200 | $115,400 |
| 2014 | $4,223 | $175,600 | $60,200 | $115,400 |
Source: Public Records
Map
Nearby Homes
- 1 Circle Ave
- 27 Fifield St Unit 13
- 2 Lyons St
- 65 Allds St
- 24 E Otterson St
- 15 Lovell St Unit 3
- 15 Lovell St Unit 7
- 15 Lovell St Unit 10
- 13 Mulvanity St
- 76 Gillis St
- 5 Mulberry St
- 36 Eastman St Unit 26
- 6 Hayden St
- 8 Buck St Unit 10
- 15 Learned St Unit 123
- 4 Chase St
- 63 Dexter St
- 22 Wilder St
- 7 Hickory St
- 17 Herrick St
- 34-36 Spalding St
- 32 Spalding St
- 32 Spalding St Unit 1
- 38 Spalding St Unit 25
- 30 Spalding St
- 29 Spalding St
- 68 Alstead Ave Unit 94
- 26 Spaulding St
- 26 Spalding St Unit 28
- 25 Benson Ave Unit 33
- 25 Spalding St Unit 45
- 2 Spalding Ave
- 2 Spalding Ave
- 5 Spalding Ave
- 17 Merrill St
- 15 Merrill St Unit 8
- 4 Alstead Ave
- 23 Benson Ave Unit 9697
- 14 Spalding St Unit 16
- 14-16 Spalding St