Estimated Value: $546,356 - $632,000
About This Home
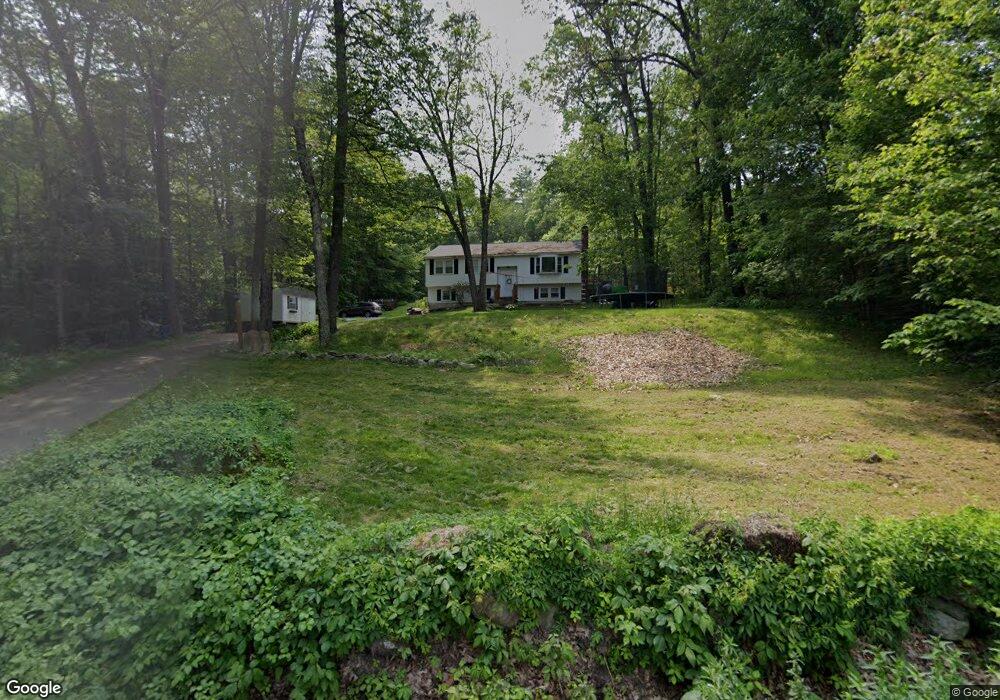
This home is located at 34 Stark Rd, Derry, NH 03038 and is currently estimated at $579,839, approximately $549 per square foot. 34 Stark Rd is a home located in Rockingham County with nearby schools including Derry Village School, West Running Brook Middle School, and Pinkerton Academy.
Ownership History
We collect this data history from publicly available records. To have your information removed, we recommend requesting removal directly through your county’s website.
Purchase Details
Home Financials for this Owner
Home Financials are based on the most recent Mortgage that was taken out on this home.Purchase Details
Home Financials for this Owner
Home Financials are based on the most recent Mortgage that was taken out on this home.Purchase Details
Purchase Details
Purchase Details
Home Values in the Area
Average Home Value in this Area
Purchase History
We collect this data history from publicly available records. To have your information removed, we recommend requesting removal directly through your county’s website.
| Date | Buyer | Sale Price | Title Company |
|---|---|---|---|
| $257,000 | -- | ||
| $239,900 | -- | ||
| $187,000 | -- | ||
| $175,000 | -- | ||
| $111,000 | -- |
Mortgage History
We collect this data history from publicly available records. To have your information removed, we recommend requesting removal directly through your county’s website.
| Date | Status | Borrower | Loan Amount |
|---|---|---|---|
| Open | $68,000 | ||
| Open | $205,600 | ||
| Previous Owner | $191,900 |
Tax History
We collect this data history from publicly available records. To have your information removed, we recommend requesting removal directly through your county’s website.
| Year | Tax Paid | Tax Assessment Tax Assessment Total Assessment is a certain percentage of the fair market value that is determined by local assessors to be the total taxable value of land and additions on the property. | Land | Improvement |
|---|---|---|---|---|
| 2025 | $8,625 | $454,200 | $215,900 | $238,300 |
| 2024 | $8,489 | $454,200 | $215,900 | $238,300 |
| 2023 | $7,736 | $374,100 | $183,500 | $190,600 |
| 2022 | $7,123 | $374,100 | $183,500 | $190,600 |
| 2021 | $7,185 | $290,200 | $143,400 | $146,800 |
| 2020 | $6,273 | $290,200 | $143,400 | $146,800 |
| 2019 | $6,627 | $253,700 | $113,800 | $139,900 |
| 2018 | $6,664 | $255,900 | $113,800 | $142,100 |
| 2017 | $6,738 | $239,200 | $108,800 | $130,400 |
| 2016 | $6,470 | $239,100 | $108,800 | $130,300 |
| 2015 | $6,603 | $225,900 | $108,800 | $117,100 |
| 2014 | $6,646 | $225,900 | $108,800 | $117,100 |
| 2013 | $6,625 | $210,400 | $100,800 | $109,600 |
Map
- 8 Stark Rd
- 41 Gervaise Dr
- 12 Miltimore Rd
- 3 Craven Terrace
- 151 Rockingham Rd Unit A
- 45 Windham Depot Rd
- 43 Lampton Dr
- 7 Valerie Ln
- 1 Featherbed Ln
- 78 Island Pond Rd
- 76 Island Pond Rd
- 242 Rockingham Rd
- 22 Depot Rd
- 59 Northland Rd
- 24 Bedard Ave
- 16 Towne Dr
- 5 Duston Rd
- 144 Rockingham Rd
- 17 Tyler Rd
- 62 Lane Rd
- 14 Stark Rd Unit Lot 03128-1
- 0 Stark Rd Unit Lot 03128 4998819
- 03128 1 Stark Rd Unit Lot 03128-1
- 0 Stark Rd Unit Lot 03128 4969319
- 0 Stark Rd
- 36 Stark Rd
- 32 Stark Rd
- 35 Stark Rd
- 33 Stark Rd
- 37 Stark Rd
- 30 Stark Rd
- 31 Stark Rd
- 38 Stark Rd
- 41 Stark Rd
- 29 Stark Rd
- 40 Stark Rd
- 28 Stark Rd
- 27 Stark Rd
- 43 Stark Rd
- 42 Stark Rd
Ask me questions while you tour the home.