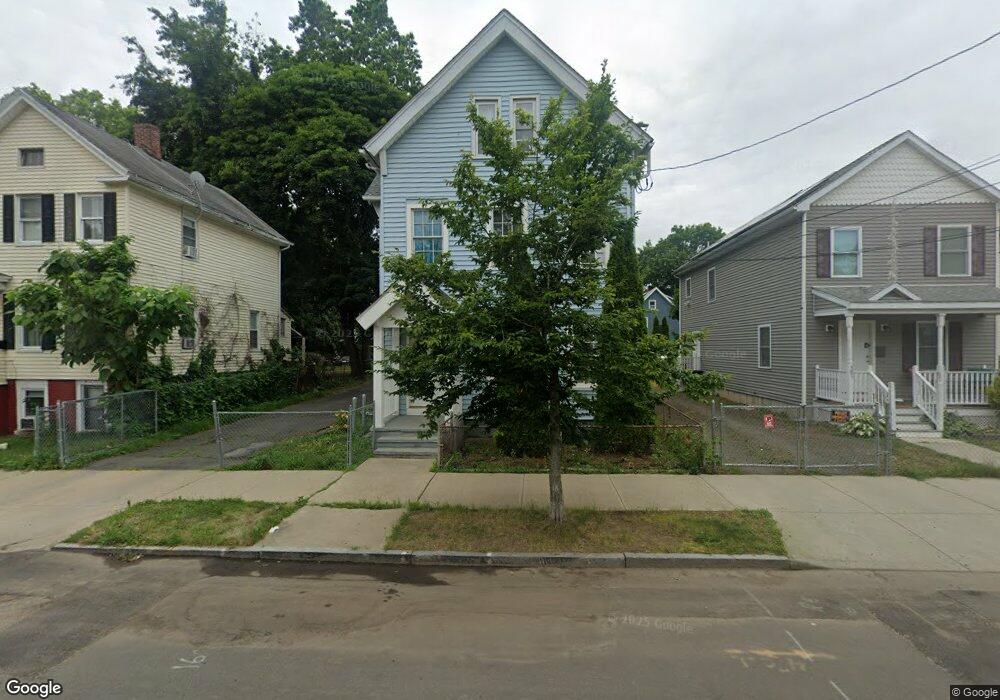
34 Wilson St New Haven, CT 06519
The Hill NeighborhoodEstimated Value: $268,000 - $412,000
5
Beds
2
Baths
2,181
Sq Ft
$151/Sq Ft
Est. Value
About This Home
This home is located at 34 Wilson St, New Haven, CT 06519 and is currently estimated at $329,718, approximately $151 per square foot. 34 Wilson St is a home located in New Haven County with nearby schools including Truman School and St Martin De Porres Academy.
Ownership History
Date
Name
Owned For
Owner Type
Purchase Details
Closed on
Jul 18, 2005
Sold by
Encore Kata
Bought by
Urbaez Pasquale and Urbaez Felicia
Current Estimated Value
Home Financials for this Owner
Home Financials are based on the most recent Mortgage that was taken out on this home.
Original Mortgage
$128,000
Interest Rate
5.67%
Purchase Details
Closed on
Dec 28, 2001
Sold by
Alaska Seaboard Ptnrs
Bought by
Ezcoke Kate
Create a Home Valuation Report for This Property
The Home Valuation Report is an in-depth analysis detailing your home's value as well as a comparison with similar homes in the area
Home Values in the Area
Average Home Value in this Area
Purchase History
| Date | Buyer | Sale Price | Title Company |
|---|---|---|---|
| Urbaez Pasquale | $160,000 | -- | |
| Ezcoke Kate | $22,000 | -- |
Source: Public Records
Mortgage History
| Date | Status | Borrower | Loan Amount |
|---|---|---|---|
| Open | Ezcoke Kate | $20,000 | |
| Open | Ezcoke Kate | $201,600 | |
| Closed | Ezcoke Kate | $128,000 |
Source: Public Records
Tax History
| Year | Tax Paid | Tax Assessment Tax Assessment Total Assessment is a certain percentage of the fair market value that is determined by local assessors to be the total taxable value of land and additions on the property. | Land | Improvement |
|---|---|---|---|---|
| 2025 | $5,135 | $130,340 | $24,150 | $106,190 |
| 2024 | $5,018 | $130,340 | $24,150 | $106,190 |
| 2023 | $4,849 | $130,340 | $24,150 | $106,190 |
| 2022 | $5,181 | $130,340 | $24,150 | $106,190 |
| 2021 | $3,284 | $74,830 | $20,860 | $53,970 |
| 2020 | $3,284 | $74,830 | $20,860 | $53,970 |
| 2019 | $3,216 | $74,830 | $20,860 | $53,970 |
| 2018 | $3,216 | $74,830 | $20,860 | $53,970 |
| 2017 | $2,894 | $74,830 | $20,860 | $53,970 |
| 2016 | $2,388 | $57,470 | $11,900 | $45,570 |
| 2015 | $2,388 | $57,470 | $11,900 | $45,570 |
| 2014 | $2,388 | $57,470 | $11,900 | $45,570 |
Source: Public Records
Map
Nearby Homes
Your Personal Tour Guide
Ask me questions while you tour the home.