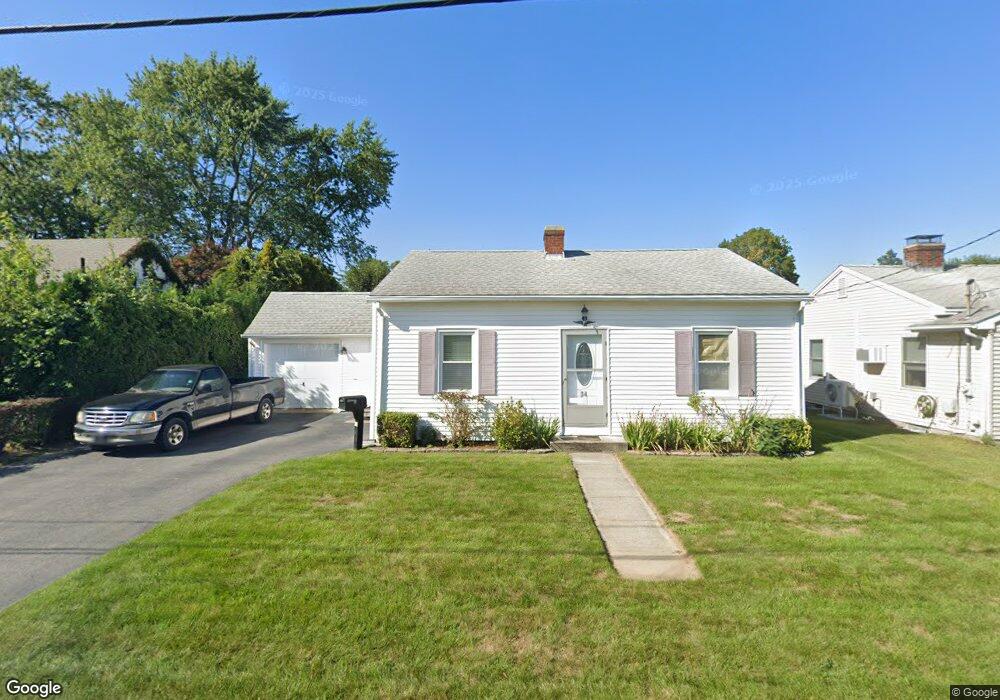
34 Winslow St Riverside, RI 02915
Riverside NeighborhoodEstimated Value: $380,219 - $481,000
2
Beds
1
Bath
906
Sq Ft
$468/Sq Ft
Est. Value
About This Home
This home is located at 34 Winslow St, Riverside, RI 02915 and is currently estimated at $423,555, approximately $467 per square foot. 34 Winslow St is a home located in Providence County with nearby schools including East Providence High School, St Luke Elementary School, and St Mary Academy-Bay View.
Ownership History
Date
Name
Owned For
Owner Type
Purchase Details
Closed on
May 25, 2007
Sold by
Oliver Roland and Oliver Kathleen
Bought by
Deoliver Steven and Deoliver Maria
Current Estimated Value
Home Financials for this Owner
Home Financials are based on the most recent Mortgage that was taken out on this home.
Original Mortgage
$146,000
Interest Rate
6.27%
Mortgage Type
Purchase Money Mortgage
Purchase Details
Closed on
Apr 29, 2004
Sold by
Taylor Lee
Bought by
Oliver Roland and Oliver Kathleen
Home Financials for this Owner
Home Financials are based on the most recent Mortgage that was taken out on this home.
Original Mortgage
$98,000
Interest Rate
5.36%
Mortgage Type
Purchase Money Mortgage
Create a Home Valuation Report for This Property
The Home Valuation Report is an in-depth analysis detailing your home's value as well as a comparison with similar homes in the area
Home Values in the Area
Average Home Value in this Area
Purchase History
| Date | Buyer | Sale Price | Title Company |
|---|---|---|---|
| Deoliver Steven | $200,000 | -- | |
| Oliver Roland | $100,000 | -- | |
| Deoliver Steven | $200,000 | -- | |
| Oliver Roland | $100,000 | -- |
Source: Public Records
Mortgage History
| Date | Status | Borrower | Loan Amount |
|---|---|---|---|
| Open | Oliver Roland | $117,500 | |
| Closed | Oliver Roland | $146,000 | |
| Previous Owner | Oliver Roland | $98,000 |
Source: Public Records
Tax History
| Year | Tax Paid | Tax Assessment Tax Assessment Total Assessment is a certain percentage of the fair market value that is determined by local assessors to be the total taxable value of land and additions on the property. | Land | Improvement |
|---|---|---|---|---|
| 2025 | $4,717 | $360,900 | $127,600 | $233,300 |
| 2024 | $4,714 | $307,500 | $106,300 | $201,200 |
| 2023 | $4,539 | $307,500 | $106,300 | $201,200 |
| 2022 | $4,142 | $189,500 | $57,100 | $132,400 |
| 2021 | $4,074 | $189,500 | $57,100 | $132,400 |
| 2020 | $3,902 | $189,500 | $57,100 | $132,400 |
| 2019 | $3,794 | $189,500 | $57,100 | $132,400 |
| 2018 | $3,956 | $172,900 | $55,500 | $117,400 |
| 2017 | $3,868 | $172,900 | $55,500 | $117,400 |
| 2016 | $3,849 | $172,900 | $55,500 | $117,400 |
| 2015 | $3,672 | $160,000 | $51,400 | $108,600 |
| 2014 | $3,672 | $160,000 | $51,400 | $108,600 |
Source: Public Records
Map
Nearby Homes
- 25 Winslow St
- 6 Meadowcrest Dr
- 25 Elinora St
- 99 Allen Ave
- 103 Burnside Ave
- 25 Arnold St
- 15 Plaza Dr
- 85 Hilton Ave
- 35 E Knowlton St
- 15 Claire St
- 151 Willett Ave Unit 2
- 151 Willett Ave Unit 5
- 10 Booth Ave
- 23 Albert Ave
- 33 Pine St Unit 35
- 2 Leigh Ln
- 72 Stowe Ave
- 28 Jefferson Ave
- 6 Hazelton Rd
- 41 White Ave