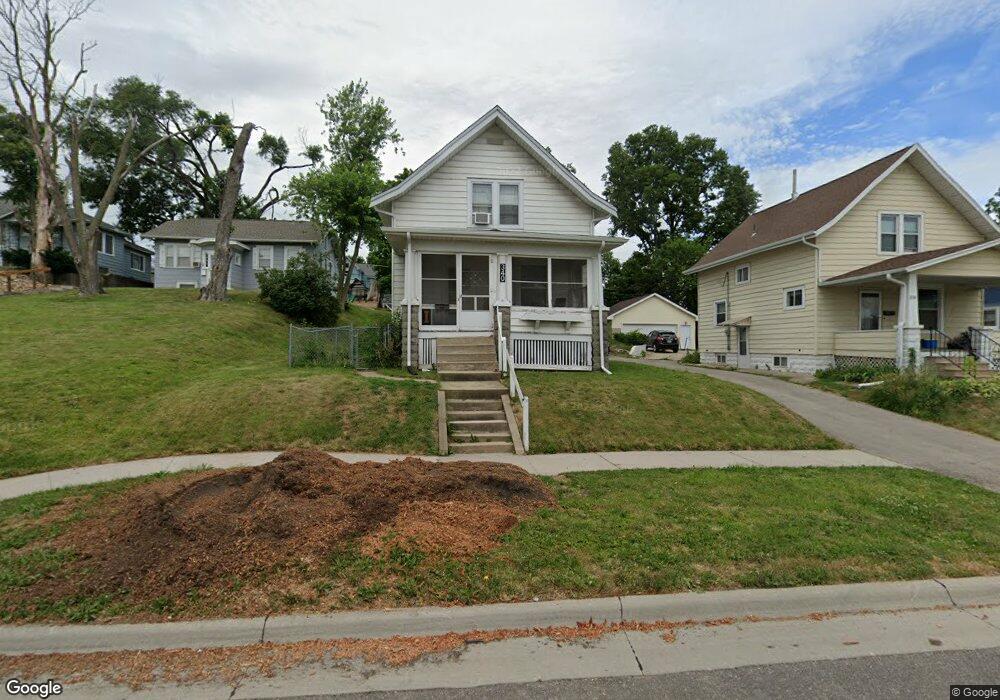
340 11th St SW Cedar Rapids, IA 52404
Taylor NeighborhoodEstimated Value: $136,000 - $192,000
4
Beds
2
Baths
1,047
Sq Ft
$155/Sq Ft
Est. Value
About This Home
This home is located at 340 11th St SW, Cedar Rapids, IA 52404 and is currently estimated at $161,875, approximately $154 per square foot. 340 11th St SW is a home located in Linn County with nearby schools including Cedar River Academy at Taylor Elementary School, Wilson Middle School, and Thomas Jefferson High School.
Ownership History
Date
Name
Owned For
Owner Type
Purchase Details
Closed on
Nov 24, 2010
Sold by
Demeulenaere Adam and Demeulenaere Karen
Bought by
Eberle Dana M
Current Estimated Value
Home Financials for this Owner
Home Financials are based on the most recent Mortgage that was taken out on this home.
Original Mortgage
$93,566
Outstanding Balance
$61,418
Interest Rate
4.17%
Mortgage Type
FHA
Estimated Equity
$100,457
Purchase Details
Closed on
Jul 31, 2002
Sold by
Watson David M and Watson Ann M
Bought by
Demeulanaere Adam
Home Financials for this Owner
Home Financials are based on the most recent Mortgage that was taken out on this home.
Original Mortgage
$86,640
Interest Rate
6.62%
Mortgage Type
FHA
Create a Home Valuation Report for This Property
The Home Valuation Report is an in-depth analysis detailing your home's value as well as a comparison with similar homes in the area
Home Values in the Area
Average Home Value in this Area
Purchase History
| Date | Buyer | Sale Price | Title Company |
|---|---|---|---|
| Eberle Dana M | $95,500 | None Available | |
| Demeulanaere Adam | $87,500 | -- |
Source: Public Records
Mortgage History
| Date | Status | Borrower | Loan Amount |
|---|---|---|---|
| Open | Eberle Dana M | $93,566 | |
| Previous Owner | Demeulanaere Adam | $86,640 |
Source: Public Records
Tax History
| Year | Tax Paid | Tax Assessment Tax Assessment Total Assessment is a certain percentage of the fair market value that is determined by local assessors to be the total taxable value of land and additions on the property. | Land | Improvement |
|---|---|---|---|---|
| 2025 | $1,898 | $134,400 | $27,500 | $106,900 |
| 2024 | $1,842 | $123,100 | $25,000 | $98,100 |
| 2023 | $1,842 | $107,200 | $25,000 | $82,200 |
| 2022 | $1,802 | $87,300 | $21,300 | $66,000 |
| 2021 | $1,916 | $87,000 | $21,300 | $65,700 |
| 2020 | $1,916 | $86,800 | $21,300 | $65,500 |
| 2019 | $1,726 | $80,100 | $21,300 | $58,800 |
Source: Public Records
Map
Nearby Homes
- 1118 2nd Ave SW
- 1155 A Ave NW
- 1221 A Ave NW
- 828 8th Ave SW
- 531 9th St SW
- 1020 A Ave NW
- 911 A Ave NW
- 1421 1st Ave SW
- 818 10th Ave SW
- 208 7th St SW
- 715 9th Ave SW
- 1128 B Ave NW
- 1338 Hinkley Ave NW
- 1218 B Ave NW
- 1602 1st Ave NW
- 452 8th Ave SW
- 460 9th Ave SW
- 1605 11th Ave SW
- 1209 16th St SW
- 250 Highland Dr NW
Your Personal Tour Guide
Ask me questions while you tour the home.