Estimated Value: $124,000 - $162,775
4
Beds
2
Baths
3,234
Sq Ft
$45/Sq Ft
Est. Value
About This Home
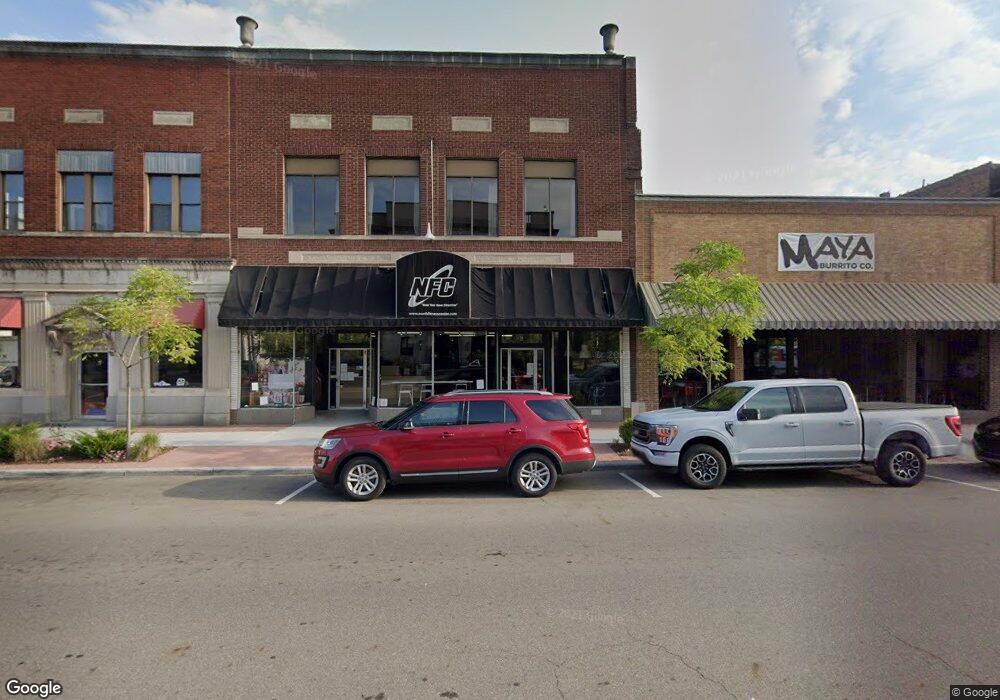
This home is located at 340 & 340 1/2 W Main St, Logan, OH 43138 and is currently estimated at $144,444, approximately $44 per square foot. 340 & 340 1/2 W Main St is a home located in Hocking County with nearby schools including Central Elementary School, St. John the Evangelist School, and Logan Christian School.
Ownership History
Date
Name
Owned For
Owner Type
Purchase Details
Closed on
Jan 6, 2022
Sold by
Caldwell and Melissa
Bought by
Maverick Investment Group Llc
Current Estimated Value
Home Financials for this Owner
Home Financials are based on the most recent Mortgage that was taken out on this home.
Original Mortgage
$84,000
Outstanding Balance
$72,245
Interest Rate
3.12%
Mortgage Type
New Conventional
Estimated Equity
$72,199
Purchase Details
Closed on
May 6, 2015
Sold by
The Citizens Bank
Bought by
Caldwell David and Caldwell Melissa
Home Financials for this Owner
Home Financials are based on the most recent Mortgage that was taken out on this home.
Original Mortgage
$45,900
Interest Rate
3.62%
Mortgage Type
Purchase Money Mortgage
Purchase Details
Closed on
Jul 9, 2014
Sold by
Dillon Neal and Dillon Fern
Bought by
The Citizens Bank
Create a Home Valuation Report for This Property
The Home Valuation Report is an in-depth analysis detailing your home's value as well as a comparison with similar homes in the area
Home Values in the Area
Average Home Value in this Area
Purchase History
| Date | Buyer | Sale Price | Title Company |
|---|---|---|---|
| Maverick Investment Group Llc | $105,000 | Thompson Paul C | |
| Maverick Investment Group Llc | $105,000 | Thompson Paul C | |
| Caldwell David | $54,000 | None Available | |
| Caldwell David | $54,000 | None Available | |
| The Citizens Bank | $72,025 | None Available | |
| The Citizens Bank | $72,025 | None Available |
Source: Public Records
Mortgage History
| Date | Status | Borrower | Loan Amount |
|---|---|---|---|
| Open | Maverick Investment Group Llc | $84,000 | |
| Previous Owner | Caldwell David | $45,900 |
Source: Public Records
Tax History Compared to Growth
Tax History
| Year | Tax Paid | Tax Assessment Tax Assessment Total Assessment is a certain percentage of the fair market value that is determined by local assessors to be the total taxable value of land and additions on the property. | Land | Improvement |
|---|---|---|---|---|
| 2024 | $1,605 | $39,760 | $7,190 | $32,570 |
| 2023 | $1,605 | $39,760 | $7,190 | $32,570 |
| 2022 | $1,607 | $39,760 | $7,190 | $32,570 |
| 2021 | $1,661 | $38,100 | $5,660 | $32,440 |
| 2020 | $1,662 | $38,100 | $5,660 | $32,440 |
| 2019 | $1,663 | $38,100 | $5,660 | $32,440 |
| 2018 | $1,101 | $25,650 | $4,890 | $20,760 |
| 2017 | $1,038 | $25,650 | $4,890 | $20,760 |
| 2016 | $1,031 | $25,650 | $4,890 | $20,760 |
| 2015 | -- | $26,200 | $5,800 | $20,400 |
| 2014 | -- | $26,200 | $5,800 | $20,400 |
| 2013 | $1,098 | $26,200 | $5,800 | $20,400 |
Source: Public Records
Map
Nearby Homes
- 385 W Main St
- 171 Warner Ave
- 150 Wood St
- 597 Henrietta Ave
- 67 W Front St
- 331 Short St
- 605 Glenwood Dr
- 28583 Hawthorne Way
- 737 Glenwood Dr
- State Route 328
- 1096 Church St
- 582 N Walnut St
- 687 N Walnut St
- 111 Falls St
- 90 S Culver St
- 288 Walnut Dr
- 743 Summit Dr
- 862 Walnut Dowler Rd
- 733 Walnut Dr
- 1288 4th St
- 340 W Main St
- 312 W Main St
- 344 W Main St
- 301 W Hunter St
- 299 W Hunter St
- 292 W Main St
- 390 W Main St
- 285 W Hunter St
- 341 W Main St
- 325 W Main St
- 290 W Main St
- 290 W Main St Unit A & B
- 283 W Hunter St
- 373 W Main St
- 359 W Main St
- 320 W Hunter St
- 308 W Hunter St
- 272 W Main St
- 273 W Hunter St
- 344 W Hunter St