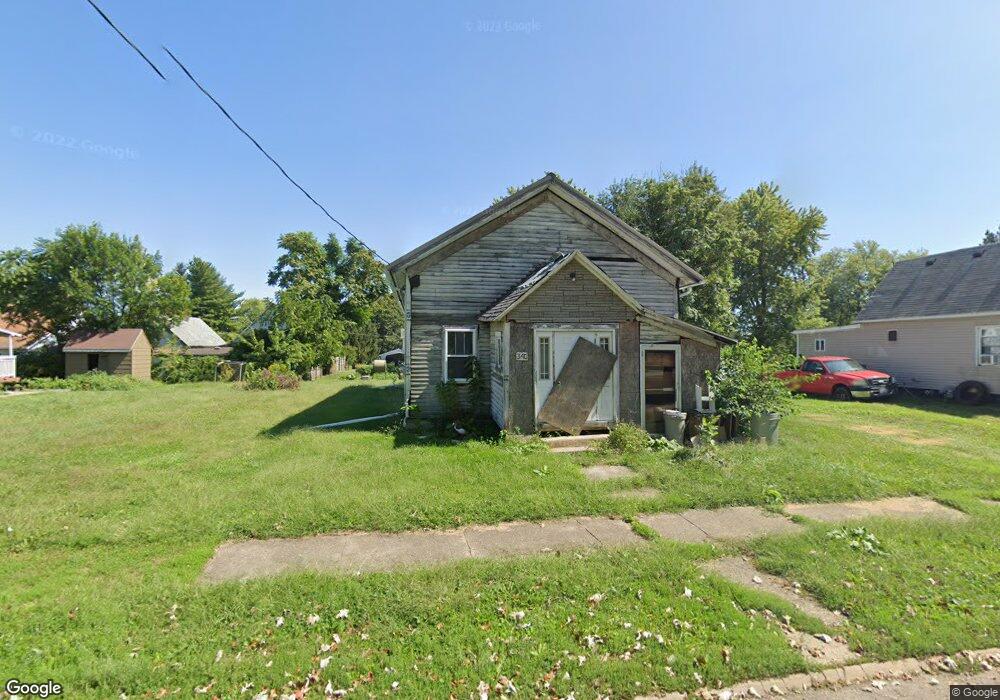
340 5th Ave Kewanee, IL 61443
Estimated Value: $57,927 - $70,000
Studio
--
Bath
1,703
Sq Ft
$39/Sq Ft
Est. Value
About This Home
This home is located at 340 5th Ave, Kewanee, IL 61443 and is currently estimated at $66,732, approximately $39 per square foot. 340 5th Ave is a home located in Henry County with nearby schools including Kewanee High School and Visitation Catholic School.
Ownership History
Date
Name
Owned For
Owner Type
Purchase Details
Closed on
Jan 22, 2026
Sold by
Henry County
Bought by
Sotelo Maricela and Sotelo Daniel
Current Estimated Value
Purchase Details
Closed on
Sep 4, 2025
Sold by
County Of Henry
Bought by
Henry County
Purchase Details
Closed on
Aug 20, 2015
Sold by
Rocha Jose
Bought by
Sterling Thomas
Purchase Details
Closed on
Feb 11, 2011
Sold by
Hier Traci and Moore Harry
Bought by
Rocha Jose
Purchase Details
Closed on
Dec 6, 2010
Sold by
County Of Henry
Bought by
T & H Investments
Purchase Details
Closed on
Sep 9, 2010
Sold by
Rocha Jose
Bought by
County Of Henry
Purchase Details
Closed on
Dec 8, 2005
Sold by
Bethel African Methodist Episcopal Churc
Bought by
Rocha Jose
Create a Home Valuation Report for This Property
The Home Valuation Report is an in-depth analysis detailing your home's value as well as a comparison with similar homes in the area
Home Values in the Area
Average Home Value in this Area
Purchase History
| Date | Buyer | Sale Price | Title Company |
|---|---|---|---|
| Sotelo Maricela | -- | None Listed On Document | |
| Henry County | -- | None Listed On Document | |
| Sterling Thomas | $12,000 | Attorney | |
| Rocha Jose | $3,500 | None Available | |
| T & H Investments | -- | None Available | |
| County Of Henry | -- | None Available | |
| Rocha Jose | -- | None Available |
Source: Public Records
Tax History
| Year | Tax Paid | Tax Assessment Tax Assessment Total Assessment is a certain percentage of the fair market value that is determined by local assessors to be the total taxable value of land and additions on the property. | Land | Improvement |
|---|---|---|---|---|
| 2024 | $928 | $8,600 | $2,167 | $6,433 |
| 2023 | $844 | $7,611 | $1,918 | $5,693 |
| 2022 | $780 | $6,925 | $1,745 | $5,180 |
| 2021 | $746 | $6,412 | $1,616 | $4,796 |
| 2020 | $733 | $6,270 | $1,580 | $4,690 |
| 2019 | $745 | $6,543 | $1,649 | $4,894 |
| 2018 | $770 | $6,704 | $1,690 | $5,014 |
| 2017 | $758 | $6,618 | $1,668 | $4,950 |
| 2016 | $765 | $6,685 | $1,685 | $5,000 |
| 2015 | -- | $6,573 | $1,657 | $4,916 |
| 2013 | -- | $6,740 | $1,699 | $5,041 |
Source: Public Records
Map
Nearby Homes
- 512 Commercial St
- 1205 Roseview Ave
- 110 N Park St
- 716 W 3rd St
- 1111 Pine St
- 702 Elliott St Unit 1
- 215 W Prospect St
- 122 Beach St S
- 422 Ross St
- 136 W Mill St
- 714 S Main St
- 732 S Main St
- 236 W Church St
- 124 E Mill St
- 716 Morton Ave
- 328 E Prospect St
- 337 Whitney Ave
- 0 N Main St Unit E 2nd
- 416 Payson St
- 630 N Burr St
Your Personal Tour Guide
Ask me questions while you tour the home.