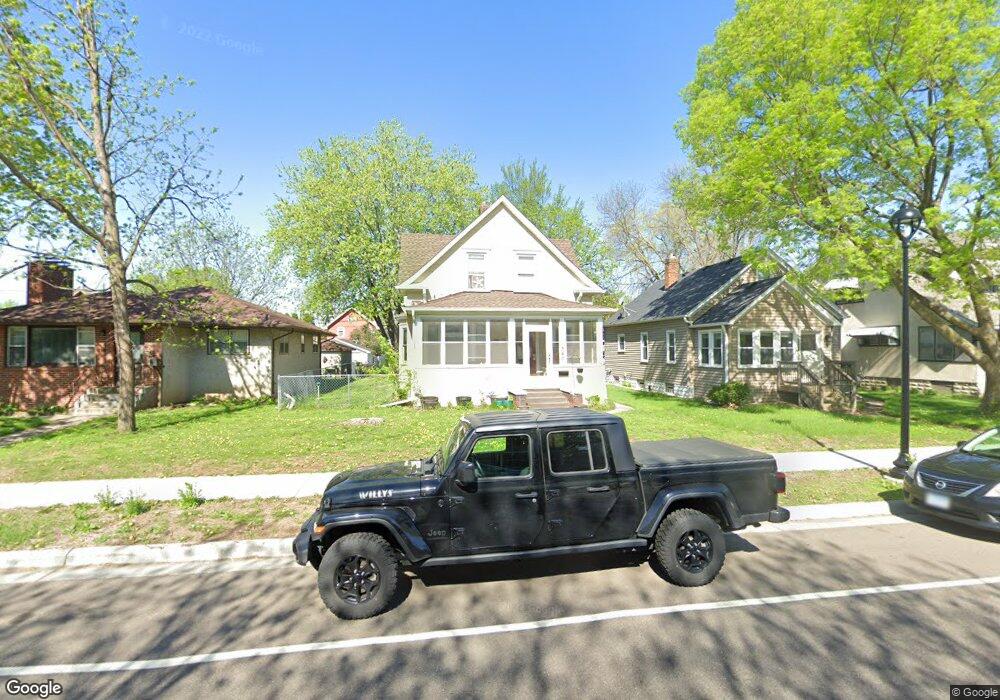
340 5th Ave S South St. Paul, MN 55075
Estimated Value: $253,000 - $276,000
4
Beds
2
Baths
1,108
Sq Ft
$242/Sq Ft
Est. Value
About This Home
This home is located at 340 5th Ave S, South St. Paul, MN 55075 and is currently estimated at $268,035, approximately $241 per square foot. 340 5th Ave S is a home located in Dakota County with nearby schools including Kaposia Education Center Elementary, South St. Paul Secondary, and Discovery Charter School.
Ownership History
Date
Name
Owned For
Owner Type
Purchase Details
Closed on
Dec 2, 2019
Sold by
Shumaker Daniel
Bought by
Johnson Paul and Johnson Timberly
Current Estimated Value
Home Financials for this Owner
Home Financials are based on the most recent Mortgage that was taken out on this home.
Original Mortgage
$151,920
Outstanding Balance
$133,939
Interest Rate
3.6%
Mortgage Type
New Conventional
Estimated Equity
$134,096
Purchase Details
Closed on
Sep 30, 2011
Sold by
Krenz Jeff and Krenz Amy
Bought by
Shumaker Daniel
Home Financials for this Owner
Home Financials are based on the most recent Mortgage that was taken out on this home.
Original Mortgage
$108,000
Interest Rate
4.08%
Mortgage Type
New Conventional
Purchase Details
Closed on
Nov 30, 2005
Sold by
Not Provided
Bought by
Not Provided
Purchase Details
Closed on
Dec 2, 2002
Sold by
Biebel Elizabeth
Bought by
Cassellius Martin J and Cassellius Lisa
Create a Home Valuation Report for This Property
The Home Valuation Report is an in-depth analysis detailing your home's value as well as a comparison with similar homes in the area
Home Values in the Area
Average Home Value in this Area
Purchase History
| Date | Buyer | Sale Price | Title Company |
|---|---|---|---|
| Johnson Paul | $189,900 | Land Title Inc | |
| Shumaker Daniel | $135,000 | Title Recording Services | |
| Not Provided | $205,000 | -- | |
| Cassellius Martin J | $158,000 | -- |
Source: Public Records
Mortgage History
| Date | Status | Borrower | Loan Amount |
|---|---|---|---|
| Open | Johnson Paul | $151,920 | |
| Previous Owner | Shumaker Daniel | $108,000 |
Source: Public Records
Tax History Compared to Growth
Tax History
| Year | Tax Paid | Tax Assessment Tax Assessment Total Assessment is a certain percentage of the fair market value that is determined by local assessors to be the total taxable value of land and additions on the property. | Land | Improvement |
|---|---|---|---|---|
| 2024 | $3,188 | $232,100 | $53,100 | $179,000 |
| 2023 | $3,188 | $227,900 | $53,400 | $174,500 |
| 2022 | $2,614 | $225,700 | $53,300 | $172,400 |
| 2021 | $2,536 | $187,800 | $46,400 | $141,400 |
| 2020 | $2,102 | $178,600 | $44,200 | $134,400 |
| 2019 | $1,833 | $170,700 | $42,000 | $128,700 |
| 2018 | $1,847 | $147,100 | $38,200 | $108,900 |
| 2017 | $1,656 | $142,600 | $36,400 | $106,200 |
| 2016 | $1,631 | $133,800 | $32,100 | $101,700 |
| 2015 | $1,584 | $101,844 | $24,344 | $77,500 |
| 2014 | -- | $105,114 | $24,548 | $80,566 |
| 2013 | -- | $88,546 | $20,640 | $67,906 |
Source: Public Records
Map
Nearby Homes
- 329 4th Ave S
- 438 6th Ave S
- 336 2nd Ave S
- 409 8th Ave S
- 454 1st Ave S
- 454 8th Ave S
- 519 8th Ave S
- 533 1st Ave S
- 105 5th Ave S
- 526 9th Ave S
- 117 8th Ave S
- 456 10th Ave S
- 443 11th Ave S
- 100 4th Ave N Unit 112
- 450 11th Ave S
- 144 10th Ave S
- 236 11th Ave S
- 531 12th Ave S
- 221 Grand Ave W Unit 104
- 116 11th Ave S