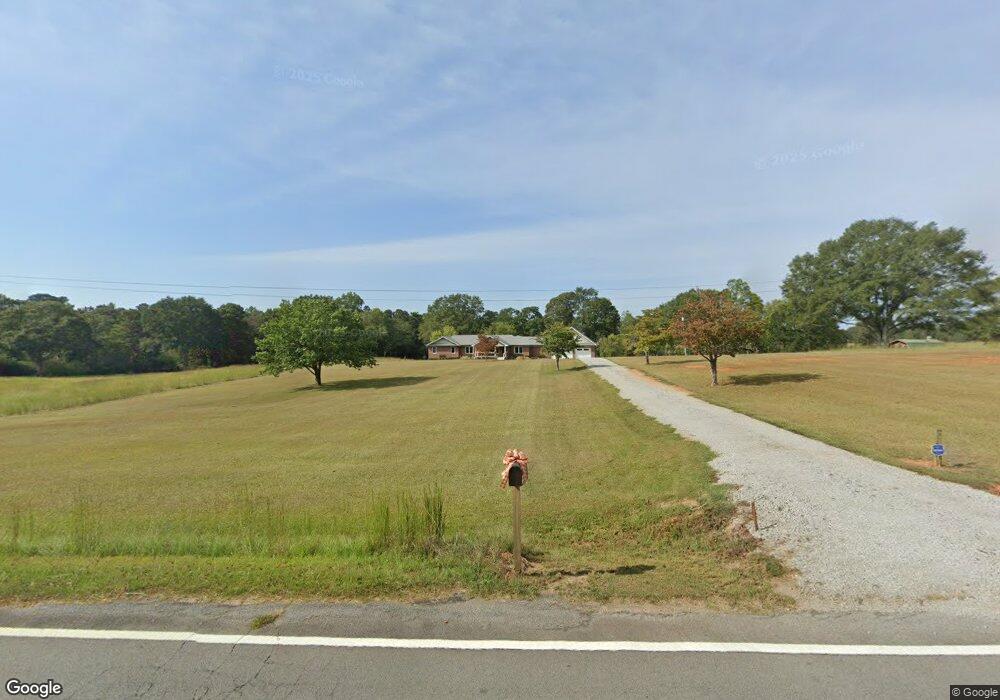
340 Burwell Rd Carrollton, GA 30117
Estimated Value: $390,000 - $467,906
2
Beds
2
Baths
3,381
Sq Ft
$129/Sq Ft
Est. Value
About This Home
This home is located at 340 Burwell Rd, Carrollton, GA 30117 and is currently estimated at $435,227, approximately $128 per square foot. 340 Burwell Rd is a home located in Carroll County with nearby schools including Bowdon Elementary School, Bowdon Middle School, and Bowdon High School.
Ownership History
Date
Name
Owned For
Owner Type
Purchase Details
Closed on
Nov 29, 2021
Sold by
Brown Janet K
Bought by
Kelley Janet
Current Estimated Value
Purchase Details
Closed on
Jun 1, 2021
Sold by
Brown Randall T
Bought by
Brown Janet K
Purchase Details
Closed on
Mar 9, 2010
Sold by
Brown Janet
Bought by
Brown Janet K
Home Financials for this Owner
Home Financials are based on the most recent Mortgage that was taken out on this home.
Original Mortgage
$203,156
Interest Rate
4.93%
Mortgage Type
New Conventional
Purchase Details
Closed on
Nov 12, 1993
Bought by
Brown
Purchase Details
Closed on
Jan 16, 1990
Bought by
Kelley Janet
Create a Home Valuation Report for This Property
The Home Valuation Report is an in-depth analysis detailing your home's value as well as a comparison with similar homes in the area
Home Values in the Area
Average Home Value in this Area
Purchase History
| Date | Buyer | Sale Price | Title Company |
|---|---|---|---|
| Kelley Janet | -- | -- | |
| Brown Janet K | -- | -- | |
| Brown Janet K | -- | -- | |
| Brown | -- | -- | |
| Kelley Janet | -- | -- |
Source: Public Records
Mortgage History
| Date | Status | Borrower | Loan Amount |
|---|---|---|---|
| Previous Owner | Brown Janet K | $203,156 |
Source: Public Records
Tax History Compared to Growth
Tax History
| Year | Tax Paid | Tax Assessment Tax Assessment Total Assessment is a certain percentage of the fair market value that is determined by local assessors to be the total taxable value of land and additions on the property. | Land | Improvement |
|---|---|---|---|---|
| 2024 | $3,001 | $161,550 | $30,269 | $131,281 |
| 2023 | $3,001 | $143,794 | $24,216 | $119,578 |
| 2022 | $2,416 | $112,163 | $16,144 | $96,019 |
| 2021 | $2,167 | $95,111 | $12,915 | $82,196 |
| 2020 | $2,022 | $86,951 | $11,741 | $75,210 |
| 2019 | $1,934 | $81,233 | $11,741 | $69,492 |
| 2018 | $1,867 | $76,086 | $10,973 | $65,113 |
| 2017 | $1,873 | $76,086 | $10,973 | $65,113 |
| 2016 | $1,874 | $76,086 | $10,973 | $65,113 |
| 2015 | $1,930 | $73,008 | $10,892 | $62,116 |
| 2014 | $1,938 | $73,008 | $10,892 | $62,116 |
Source: Public Records
Map
Nearby Homes
- 3680 W Highway 166
- 33 & 67 Lambert Ln
- 92 Old Bowdon Rd
- 96 Old Bowdon Rd
- 0 Wynn Rd
- 40 Red Holly Gap
- 37 Cedar Dr
- 21 Crabapple Place
- 2070 Lovvorn Rd
- 101 Bonnie Lynn Ln
- 103 Red Oak Dr
- 64 Twin Oak Dr
- 102 Red Oak Dr
- The Coleman Plan at Summerfield Place
- The Pearson Plan at Summerfield Place
- The Piedmont Plan at Summerfield Place
- The Harrington Plan at Summerfield Place
- The McGinnis Plan at Summerfield Place
- The Telfair Plan at Summerfield Place
- 316 Burwell Rd
- 350 Burwell Rd
- 304 Burwell Rd
- 292 Burwell Rd
- 468 Burwell Rd
- 278 Burwell Rd
- 550 Burwell Rd
- 234 Burwell Rd
- 881 Cole Rd
- 546 Burwell Rd
- 199 Burwell Rd
- 562 Burwell Rd
- 160 Burwell Rd
- 146 Burwell Rd
- 141 Burwell Rd
- 132 Burwell Rd
- 118 Burwell Rd
- 609 Burwell Rd
- 3735 W Highway 166
- 102 Burwell Rd