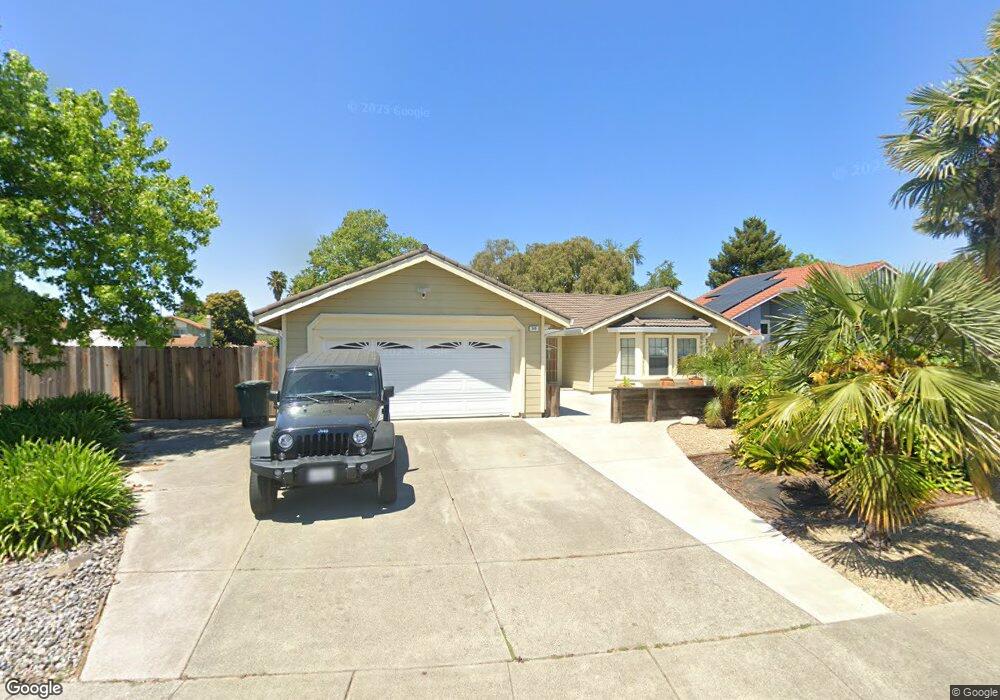
340 Chaucer Ct American Canyon, CA 94503
Estimated Value: $557,000 - $765,000
3
Beds
2
Baths
1,402
Sq Ft
$450/Sq Ft
Est. Value
About This Home
This home is located at 340 Chaucer Ct, American Canyon, CA 94503 and is currently estimated at $630,856, approximately $449 per square foot. 340 Chaucer Ct is a home located in Napa County with nearby schools including Donaldson Way Elementary School, American Canyon Middle School, and American Canyon High School.
Ownership History
Date
Name
Owned For
Owner Type
Purchase Details
Closed on
Dec 17, 2021
Sold by
Norwick Mitchell and Norwick Danine S
Bought by
Norwick Mitchell and Norwick Danine S
Current Estimated Value
Home Financials for this Owner
Home Financials are based on the most recent Mortgage that was taken out on this home.
Original Mortgage
$273,000
Outstanding Balance
$251,122
Interest Rate
3.12%
Mortgage Type
New Conventional
Estimated Equity
$379,734
Purchase Details
Closed on
Apr 17, 2000
Sold by
Geocentral Inc
Bought by
Norwick Mitchell and Norwick Danine S
Home Financials for this Owner
Home Financials are based on the most recent Mortgage that was taken out on this home.
Original Mortgage
$214,673
Interest Rate
8.24%
Mortgage Type
FHA
Purchase Details
Closed on
Oct 5, 1999
Sold by
Vanblarcom Deborah and Vanblarcom Deborah
Bought by
Geocentral Inc
Create a Home Valuation Report for This Property
The Home Valuation Report is an in-depth analysis detailing your home's value as well as a comparison with similar homes in the area
Home Values in the Area
Average Home Value in this Area
Purchase History
| Date | Buyer | Sale Price | Title Company |
|---|---|---|---|
| Norwick Mitchell | -- | Avenue 365 Lender Svcs Llc | |
| Norwick Mitchell | $223,000 | Napa Land Title Company | |
| Geocentral Inc | -- | Napa Land Title Company |
Source: Public Records
Mortgage History
| Date | Status | Borrower | Loan Amount |
|---|---|---|---|
| Open | Norwick Mitchell | $273,000 | |
| Closed | Norwick Mitchell | $214,673 |
Source: Public Records
Tax History Compared to Growth
Tax History
| Year | Tax Paid | Tax Assessment Tax Assessment Total Assessment is a certain percentage of the fair market value that is determined by local assessors to be the total taxable value of land and additions on the property. | Land | Improvement |
|---|---|---|---|---|
| 2025 | $3,753 | $342,730 | $130,635 | $212,095 |
| 2024 | $3,753 | $336,011 | $128,074 | $207,937 |
| 2023 | $3,753 | $329,423 | $125,563 | $203,860 |
| 2022 | $3,620 | $322,964 | $123,101 | $199,863 |
| 2021 | $3,559 | $316,633 | $120,688 | $195,945 |
| 2020 | $3,529 | $313,387 | $119,451 | $193,936 |
| 2019 | $3,461 | $307,243 | $117,109 | $190,134 |
| 2018 | $3,425 | $301,219 | $114,813 | $186,406 |
| 2017 | $3,367 | $295,313 | $112,562 | $182,751 |
| 2016 | $3,326 | $289,523 | $110,355 | $179,168 |
| 2015 | $3,135 | $285,175 | $108,698 | $176,477 |
| 2014 | $3,090 | $279,590 | $106,569 | $173,021 |
Source: Public Records
Map
Nearby Homes
- 442 Northrup Ln
- 240 Newbury Way
- 2117 Elliott Dr
- 177 Brophy St
- 706 Capra Dr
- 1634 Severus Dr
- 259 Los Altos Place
- 205 Marla Dr
- 3000 St Unit 92
- 1509 Rio Grande
- 3000 Broadway St Unit 16
- 3000 Broadway St Unit 13
- 3000 Broadway St Unit 62
- 2041 Severus Dr
- 121 Yankee Jim Ct
- 18 Joan Dr
- 240 Rinaldo Dr
- 160 Shari Ct
- 149 Drytown Ct
- 0 Melvin Rd Unit 324032405
- 336 Chaucer Ct
- 345 Northampton Dr
- 401 Northampton Dr
- 341 Northampton Dr
- 334 Chaucer Ct
- 337 Chaucer Ct
- 341 Chaucer Ct
- 575 Chaucer Ln
- 568 Chaucer Ln
- 330 Chaucer Ct
- 333 Chaucer Ct
- 337 Northampton Dr
- 405 Northampton Dr
- 571 Chaucer Ln
- 331 Northampton Dr
- 564 Chaucer Ln
- 321 Brookshire Ct
- 409 Northampton Dr
- 334 Kensington Way
- 338 Kensington Way