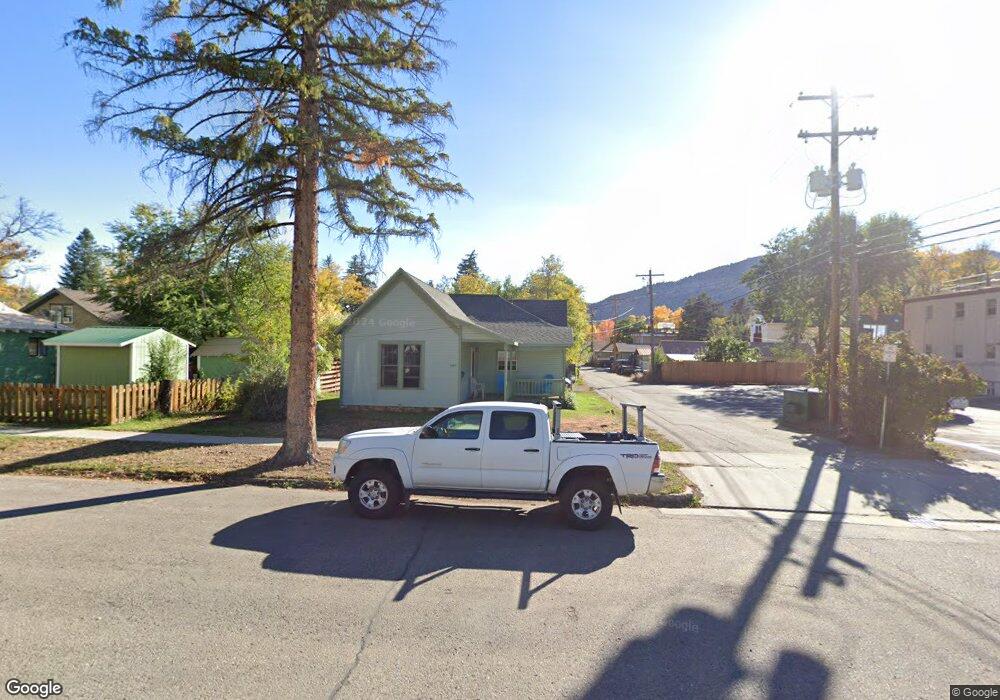
340 E 11th St Durango, CO 81301
The Grid NeighborhoodEstimated Value: $596,908 - $784,000
2
Beds
1
Bath
1,073
Sq Ft
$645/Sq Ft
Est. Value
About This Home
This home is located at 340 E 11th St, Durango, CO 81301 and is currently estimated at $692,227, approximately $645 per square foot. 340 E 11th St is a home located in La Plata County with nearby schools including Park Elementary School, Escalante Middle School, and Durango High School.
Create a Home Valuation Report for This Property
The Home Valuation Report is an in-depth analysis detailing your home's value as well as a comparison with similar homes in the area
Home Values in the Area
Average Home Value in this Area
Tax History
| Year | Tax Paid | Tax Assessment Tax Assessment Total Assessment is a certain percentage of the fair market value that is determined by local assessors to be the total taxable value of land and additions on the property. | Land | Improvement |
|---|---|---|---|---|
| 2025 | $1,263 | $34,170 | $13,400 | $20,770 |
| 2024 | $1,074 | $26,730 | $9,520 | $17,210 |
| 2023 | $1,074 | $29,700 | $10,580 | $19,120 |
| 2022 | $988 | $31,550 | $11,240 | $20,310 |
| 2021 | $993 | $25,010 | $9,680 | $15,330 |
| 2020 | $922 | $23,990 | $9,580 | $14,410 |
| 2019 | $882 | $23,990 | $9,580 | $14,410 |
| 2018 | $820 | $22,580 | $9,080 | $13,500 |
| 2017 | $802 | $22,580 | $9,080 | $13,500 |
| 2016 | $727 | $22,310 | $8,680 | $13,630 |
| 2015 | $681 | $22,310 | $8,680 | $13,630 |
| 2014 | -- | $19,990 | $8,340 | $11,650 |
| 2013 | -- | $19,990 | $8,340 | $11,650 |
Source: Public Records
Map
Nearby Homes
- 1330 E 3rd Ave
- 960 E 4th Ave
- 1404 E 3rd Ave
- TBD Wilson Gulch Rd
- 1201 Main Ave Unit 105
- 834 E 4th Ave
- 125 W 10th St Unit 104
- TBD - Lot G Highway 550
- TBD (Tract C) Highway 550
- 49789 Highway 550
- 0 Tbd Unit 11662135
- 0 Tbd Unit 26426680
- 768 Main Ave Unit 4
- 610 E 3rd Ave
- Lot 15 Taylor Ranch Rd
- 270 E College Dr Unit 202
- 558 E 4th Ave
- 561 E 6th Ave
- 522 E 3rd Ave
- 549 E 5th Ave
- 1061 E 4th Ave
- 1071 E 4th Ave
- 1051 E 4th Ave
- 1045 E 4th Ave
- 1039 E 4th Ave
- 0 E 3rd Ave Unit Corner of College &
- 0 E 3rd Ave Unit 697546
- 0 E 3rd Ave Unit 701501
- 1046 E 3rd Ave
- 1101 E 4th Ave
- 1035 E 4th Ave
- 1040 E 3rd Ave
- 1115 E 4th Ave
- 1021 E 4th Ave
- 1108 E 3rd Ave
- 1121 E 4th Ave
- 1015 E 4th Ave
- 1020 E 3rd Ave
- 1120 E 3rd Ave
- 1125 E 4th Ave
Your Personal Tour Guide
Ask me questions while you tour the home.