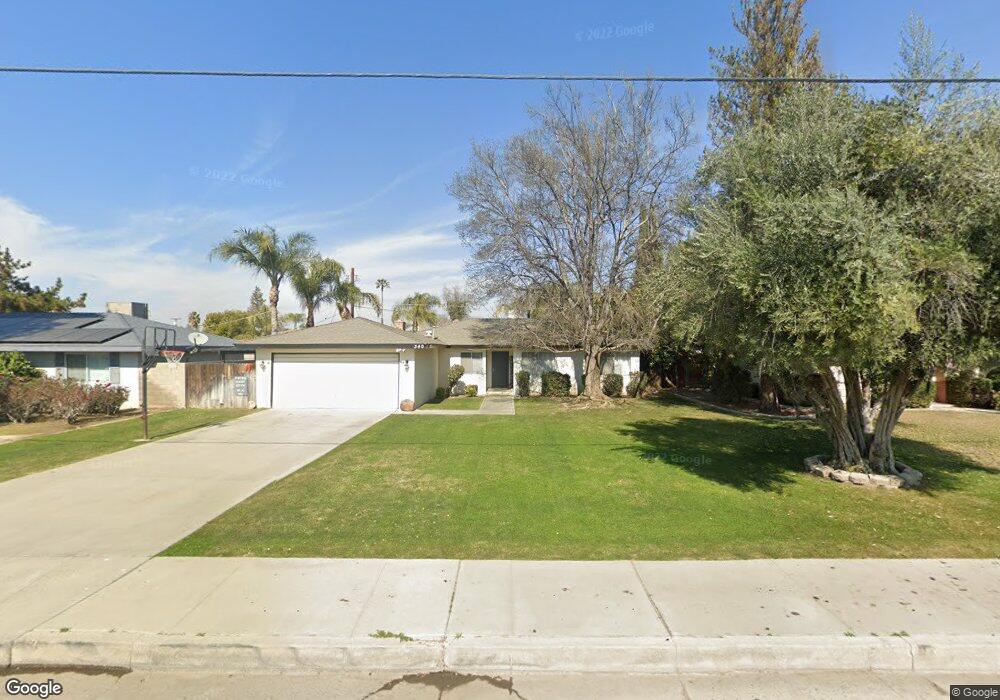
340 E Tulare Ave Shafter, CA 93263
Estimated Value: $285,000 - $308,000
2
Beds
2
Baths
1,260
Sq Ft
$233/Sq Ft
Est. Value
About This Home
This home is located at 340 E Tulare Ave, Shafter, CA 93263 and is currently estimated at $293,524, approximately $232 per square foot. 340 E Tulare Ave is a home located in Kern County with nearby schools including Sequoia Elementary School, Shafter High School, and Grow Academy Shafter.
Ownership History
Date
Name
Owned For
Owner Type
Purchase Details
Closed on
Feb 15, 2012
Sold by
Blair Corey A
Bought by
Jmmkm Investments Inc
Current Estimated Value
Purchase Details
Closed on
Aug 11, 2008
Sold by
Blair Corey A and Blair Amy L
Bought by
Blair Corey A
Purchase Details
Closed on
Aug 19, 2004
Sold by
Gonzales Richard and Gonzales Olga Martha
Bought by
Blair Corey Alan and Blair Amy Lynn
Purchase Details
Closed on
Jun 12, 2000
Sold by
Wood Jason D and Wood Melissa A
Bought by
Gonzales Richard and Gonzales Olga Martha
Home Financials for this Owner
Home Financials are based on the most recent Mortgage that was taken out on this home.
Original Mortgage
$82,450
Interest Rate
8.67%
Purchase Details
Closed on
Jan 15, 1997
Sold by
Williams Marvin L and Williams Diana L
Bought by
Wood Jason D and Wood Melissa A
Home Financials for this Owner
Home Financials are based on the most recent Mortgage that was taken out on this home.
Original Mortgage
$77,863
Interest Rate
7.86%
Mortgage Type
FHA
Create a Home Valuation Report for This Property
The Home Valuation Report is an in-depth analysis detailing your home's value as well as a comparison with similar homes in the area
Home Values in the Area
Average Home Value in this Area
Purchase History
| Date | Buyer | Sale Price | Title Company |
|---|---|---|---|
| Jmmkm Investments Inc | $107,000 | Ticor Title Company Of Ca | |
| Blair Corey A | -- | None Available | |
| Blair Corey Alan | $155,000 | Stewart Title | |
| Gonzales Richard | $85,000 | Stewart Title | |
| Wood Jason D | $78,000 | American Title Co |
Source: Public Records
Mortgage History
| Date | Status | Borrower | Loan Amount |
|---|---|---|---|
| Previous Owner | Gonzales Richard | $82,450 | |
| Previous Owner | Wood Jason D | $77,863 |
Source: Public Records
Tax History
| Year | Tax Paid | Tax Assessment Tax Assessment Total Assessment is a certain percentage of the fair market value that is determined by local assessors to be the total taxable value of land and additions on the property. | Land | Improvement |
|---|---|---|---|---|
| 2025 | $1,818 | $134,386 | $25,114 | $109,272 |
| 2024 | $1,760 | $131,752 | $24,622 | $107,130 |
| 2023 | $1,760 | $129,170 | $24,140 | $105,030 |
| 2022 | $1,694 | $126,638 | $23,667 | $102,971 |
| 2021 | $1,630 | $124,155 | $23,203 | $100,952 |
| 2020 | $1,581 | $122,883 | $22,966 | $99,917 |
| 2019 | $1,579 | $122,883 | $22,966 | $99,917 |
| 2018 | $1,520 | $118,113 | $22,075 | $96,038 |
| 2017 | $1,512 | $115,798 | $21,643 | $94,155 |
| 2016 | $1,427 | $113,528 | $21,219 | $92,309 |
| 2015 | $1,391 | $111,824 | $20,901 | $90,923 |
| 2014 | $1,340 | $109,634 | $20,492 | $89,142 |
Source: Public Records
Map
Nearby Homes
- 580 Harris Dr
- 365 Redwood Dr
- 0 Acacia Ave
- 155 Redwood Dr
- 200 Justin Ct
- 356 Faber St
- 300 Mannel Ave
- 719 Mannel Ave
- 901 Katie Ct
- 914 Tomboy Ct
- 208 California Ave
- 9414 Woodland Ridge Ln
- 9803 Crystal Falls Ln
- 9405 Laurel Ridge Ln
- 278 Walnut St
- 848 Sonora Dr
- 4016 Green Way
- 8728 Brindlewood Ave
- 8724 Brindlewood Ave
- 0 Beech Ave Unit IG25056068
- 350 E Tulare Ave
- 330 E Tulare Ave
- 516 Hofman Ct
- 508 Hofman Ct
- 524 Hofman Ct
- 505 Acacia Ave
- 713 California Ave
- 501 Hofman Dr
- 509 Hofman Dr
- 525 Acacia Ave
- 723 California Ave
- 701 California Ave
- 517 Hofman Dr
- 305 Calloway St
- 532 Hofman Ct
- 525 Hofman Dr
- 545 Acacia Ave
- 548 Hofman Ct
- 540 Hofman Ct
- 650 Sunset Ave
Your Personal Tour Guide
Ask me questions while you tour the home.