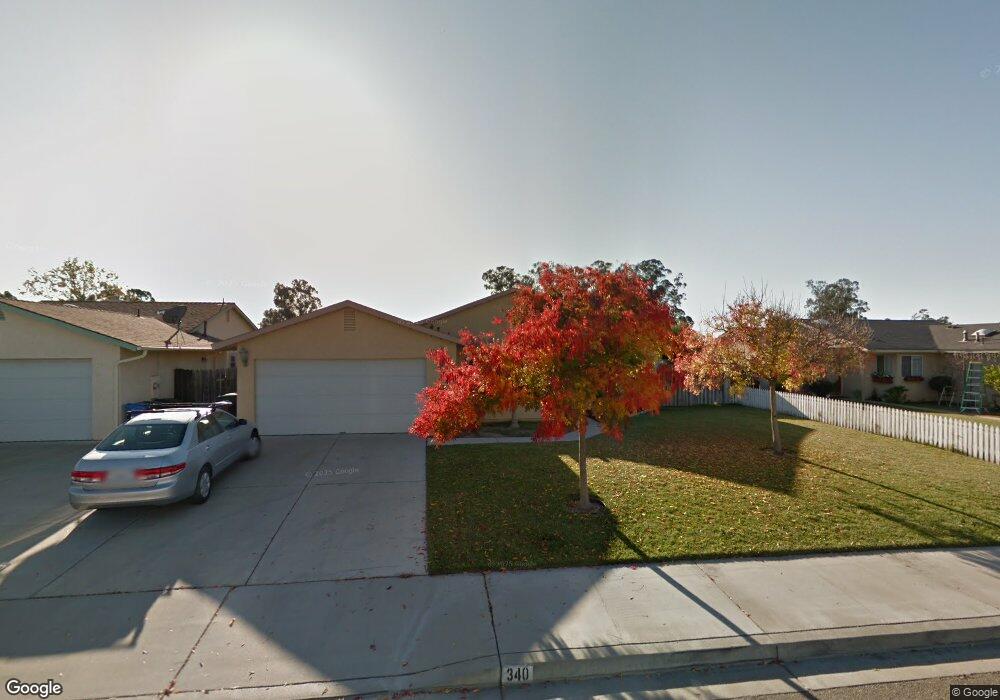
340 Kestrel Way Nipomo, CA 93444
Estimated Value: $659,678 - $708,000
3
Beds
2
Baths
1,332
Sq Ft
$516/Sq Ft
Est. Value
About This Home
This home is located at 340 Kestrel Way, Nipomo, CA 93444 and is currently estimated at $687,170, approximately $515 per square foot. 340 Kestrel Way is a home located in San Luis Obispo County with nearby schools including Dana Elementary School, Mesa Middle School, and Nipomo High School.
Ownership History
Date
Name
Owned For
Owner Type
Purchase Details
Closed on
May 10, 2017
Sold by
Hulsizer Richard M
Bought by
Hulsizer Richard M
Current Estimated Value
Purchase Details
Closed on
Apr 4, 2006
Sold by
Hulsizer Coleen M
Bought by
Hulsizer Richard M
Purchase Details
Closed on
Feb 27, 2002
Sold by
Hernandez Aurelio M and Hernandez Rosa Ma
Bought by
Hernandez Aurelio M and Hernandez Rosa Maria
Purchase Details
Closed on
Jul 18, 1994
Sold by
Bonita Homes Inc
Bought by
Hulsizer Richard M and Hulsizer Coleen M
Home Financials for this Owner
Home Financials are based on the most recent Mortgage that was taken out on this home.
Original Mortgage
$123,400
Interest Rate
4.75%
Create a Home Valuation Report for This Property
The Home Valuation Report is an in-depth analysis detailing your home's value as well as a comparison with similar homes in the area
Home Values in the Area
Average Home Value in this Area
Purchase History
| Date | Buyer | Sale Price | Title Company |
|---|---|---|---|
| Hulsizer Richard M | -- | None Available | |
| Hulsizer Richard M | -- | None Available | |
| Hernandez Aurelio M | -- | -- | |
| Hulsizer Richard M | $130,000 | Cuesta Title Guaranty Compan |
Source: Public Records
Mortgage History
| Date | Status | Borrower | Loan Amount |
|---|---|---|---|
| Previous Owner | Hulsizer Richard M | $123,400 |
Source: Public Records
Tax History Compared to Growth
Tax History
| Year | Tax Paid | Tax Assessment Tax Assessment Total Assessment is a certain percentage of the fair market value that is determined by local assessors to be the total taxable value of land and additions on the property. | Land | Improvement |
|---|---|---|---|---|
| 2025 | $2,264 | $218,320 | $100,763 | $117,557 |
| 2024 | $2,238 | $214,040 | $98,788 | $115,252 |
| 2023 | $2,238 | $209,844 | $96,851 | $112,993 |
| 2022 | $2,204 | $205,730 | $94,952 | $110,778 |
| 2021 | $2,200 | $201,697 | $93,091 | $108,606 |
| 2020 | $2,175 | $199,630 | $92,137 | $107,493 |
| 2019 | $2,162 | $195,717 | $90,331 | $105,386 |
| 2018 | $2,137 | $191,880 | $88,560 | $103,320 |
| 2017 | $2,020 | $188,119 | $86,824 | $101,295 |
| 2016 | $1,904 | $184,431 | $85,122 | $99,309 |
| 2015 | $1,876 | $181,662 | $83,844 | $97,818 |
| 2014 | $1,806 | $178,104 | $82,202 | $95,902 |
Source: Public Records
Map
Nearby Homes
- 483 Violet Ave
- 232 Scarlett Cir
- 522 Higos Way
- Mesa Plan at Hill Street Terraces - Hill Street Series
- Pacific Plan at Hill Street Terraces - Hill Street Series
- Monarch Plan at Hill Street Terraces - Hill Street Series
- Rancho Plan at Hill Street Terraces - Hill Street Series
- Dana Plan at Hill Street Terraces - Hill Street Series
- 680 Hill St
- 719 W Tefft St
- 945 Jeanette Ln
- 457 Polaris Dr
- 261 Hazel Ln
- 626 Juno Ct
- 426 Polaris Dr
- 840 Story St
- 725 Monarch Ln
- 368 Avenida de Amigos
- 759 Viola Ct
- 450 Avenida de Socios Unit 12