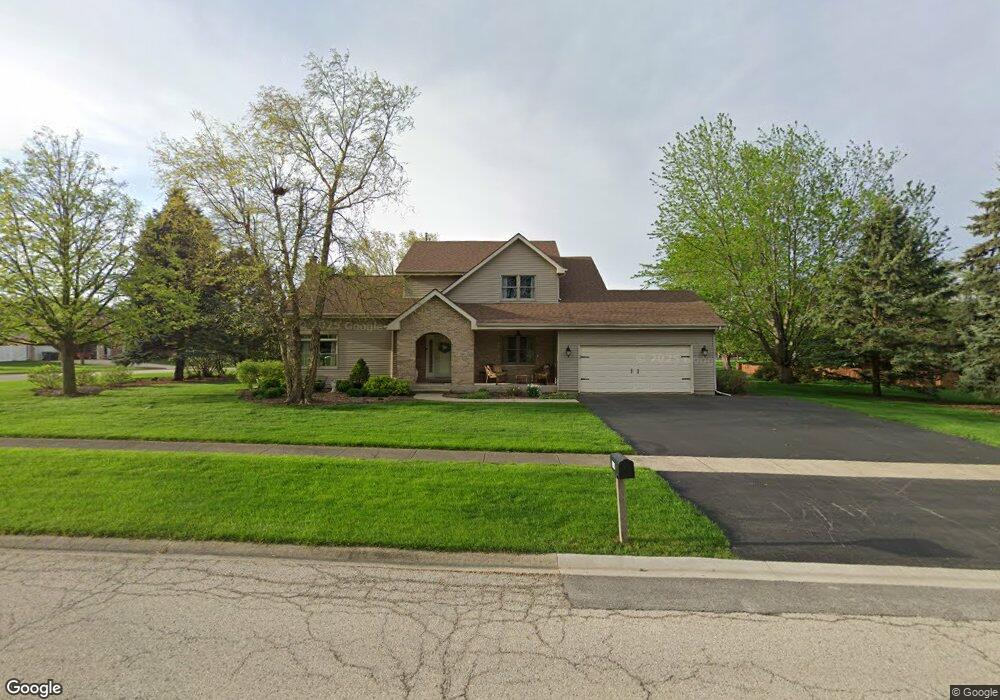
340 Lilas Ct New Lenox, IL 60451
Estimated Value: $414,000 - $565,000
Studio
--
Bath
--
Sq Ft
0.7
Acres
About This Home
This home is located at 340 Lilas Ct, New Lenox, IL 60451 and is currently estimated at $474,431. 340 Lilas Ct is a home located in Will County with nearby schools including Oster-Oakview School, Haines Elementary School, and Lincoln Way West.
Ownership History
Date
Name
Owned For
Owner Type
Purchase Details
Closed on
Mar 15, 2001
Sold by
Goffinet Michael J and Goffinet Sandra M
Bought by
Goffinet Michael J and Goffinet Sandra M
Current Estimated Value
Home Financials for this Owner
Home Financials are based on the most recent Mortgage that was taken out on this home.
Original Mortgage
$97,300
Interest Rate
7.18%
Purchase Details
Closed on
Mar 2, 2001
Sold by
Goffinet Michael J and Goffinet Sandra M
Bought by
Goffinet Michael J and Goffinet Sandra M
Home Financials for this Owner
Home Financials are based on the most recent Mortgage that was taken out on this home.
Original Mortgage
$97,300
Interest Rate
7.18%
Purchase Details
Closed on
Sep 28, 2000
Sold by
Goffinet Michael J and Goffinet Sandra M
Bought by
Goffinet Michael J and Goffinet Sandra M
Purchase Details
Closed on
Sep 24, 1996
Sold by
Goffinet Michael J and Goffinet Sandra M
Bought by
Goffinet Michael J and Goffinet Sandra M
Purchase Details
Closed on
Oct 31, 1991
Bought by
Goffinet Michael
Create a Home Valuation Report for This Property
The Home Valuation Report is an in-depth analysis detailing your home's value as well as a comparison with similar homes in the area
Home Values in the Area
Average Home Value in this Area
Purchase History
| Date | Buyer | Sale Price | Title Company |
|---|---|---|---|
| Goffinet Michael J | -- | Chicago Title Insurance Co | |
| Goffinet Michael J | -- | Chicago Title Insurance Co | |
| Goffinet Michael J | -- | -- | |
| Goffinet Michael J | -- | -- | |
| Goffinet Michael | $25,000 | -- |
Source: Public Records
Mortgage History
| Date | Status | Borrower | Loan Amount |
|---|---|---|---|
| Closed | Goffinet Michael J | $97,300 |
Source: Public Records
Tax History
| Year | Tax Paid | Tax Assessment Tax Assessment Total Assessment is a certain percentage of the fair market value that is determined by local assessors to be the total taxable value of land and additions on the property. | Land | Improvement |
|---|---|---|---|---|
| 2024 | $10,449 | $149,543 | $27,881 | $121,662 |
| 2023 | $10,449 | $136,320 | $25,416 | $110,904 |
| 2022 | $9,984 | $125,583 | $23,414 | $102,169 |
| 2021 | $9,051 | $118,107 | $22,020 | $96,087 |
| 2020 | $8,777 | $113,893 | $21,234 | $92,659 |
| 2019 | $8,383 | $110,362 | $20,576 | $89,786 |
| 2018 | $8,174 | $106,558 | $19,866 | $86,692 |
| 2017 | $8,165 | $103,495 | $19,295 | $84,200 |
| 2016 | $7,926 | $100,725 | $18,779 | $81,946 |
| 2015 | $7,622 | $97,555 | $18,188 | $79,367 |
| 2014 | $7,622 | $96,350 | $17,963 | $78,387 |
| 2013 | $7,622 | $97,649 | $18,205 | $79,444 |
Source: Public Records
Map
Nearby Homes
- 225 E Francis Rd
- 830 Wagon Dr
- 1605 S Regan Rd
- 113 Town Crest Dr Unit D
- 1110 Lakeside Dr
- 209 Linden Oaks Ln
- 639 N Marley Rd
- 0 N Cedar Rd
- 137 Kimber Dr
- 13621 W Maple Rd
- 523 N Cedar Rd
- 18830 Carrie Ct
- 380 N Cedar Rd
- 13741 Elizabeth Ln
- 338 Willow St
- 19427 Hunter Trail
- 0000 W Regan Rd
- 1193 Georgias Way
- 12858 W Regan Rd
- 13018 W Regan Rd
Your Personal Tour Guide
Ask me questions while you tour the home.