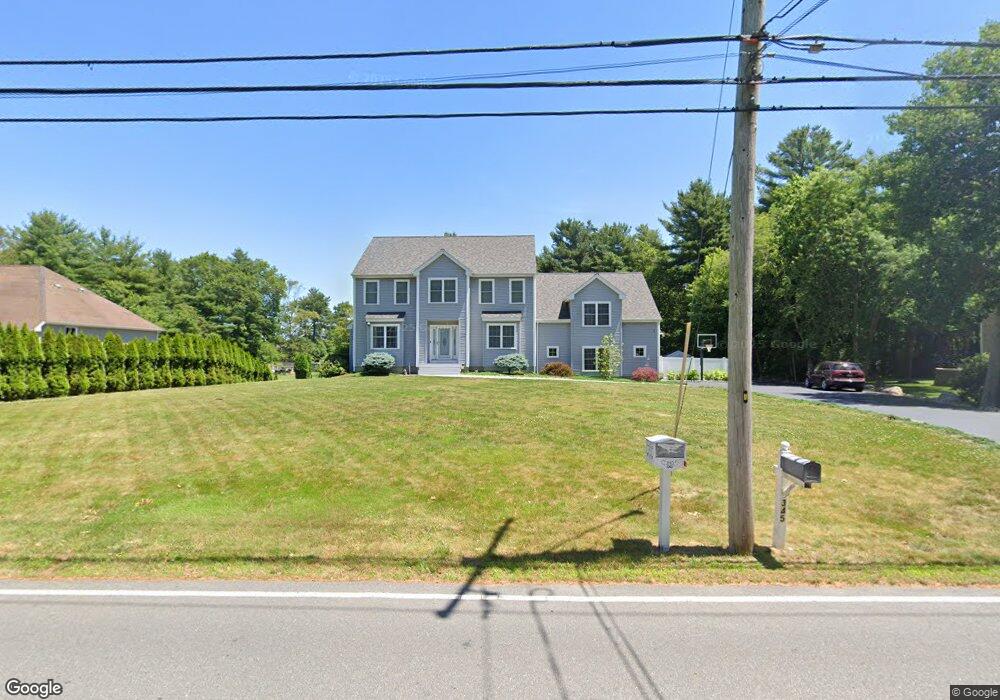
340 Locust St Raynham, MA 02767
Estimated Value: $780,308 - $876,000
3
Beds
3
Baths
2,514
Sq Ft
$331/Sq Ft
Est. Value
About This Home
This home is located at 340 Locust St, Raynham, MA 02767 and is currently estimated at $831,577, approximately $330 per square foot. 340 Locust St is a home located in Bristol County with nearby schools including LaLiberte Elementary School, Merrill Elementary School, and Williams Intermediate School.
Ownership History
Date
Name
Owned For
Owner Type
Purchase Details
Closed on
Feb 7, 2002
Sold by
Mccarthy Raymond and Mccarthy Luanne
Bought by
Lazaro John M and Lazaro Sonia R
Current Estimated Value
Home Financials for this Owner
Home Financials are based on the most recent Mortgage that was taken out on this home.
Original Mortgage
$72,000
Interest Rate
7.13%
Mortgage Type
Purchase Money Mortgage
Create a Home Valuation Report for This Property
The Home Valuation Report is an in-depth analysis detailing your home's value as well as a comparison with similar homes in the area
Home Values in the Area
Average Home Value in this Area
Purchase History
| Date | Buyer | Sale Price | Title Company |
|---|---|---|---|
| Lazaro John M | $90,000 | -- |
Source: Public Records
Mortgage History
| Date | Status | Borrower | Loan Amount |
|---|---|---|---|
| Open | Lazaro John M | $385,000 | |
| Closed | Lazaro John M | $72,000 |
Source: Public Records
Tax History
| Year | Tax Paid | Tax Assessment Tax Assessment Total Assessment is a certain percentage of the fair market value that is determined by local assessors to be the total taxable value of land and additions on the property. | Land | Improvement |
|---|---|---|---|---|
| 2025 | $8,107 | $670,000 | $220,400 | $449,600 |
| 2024 | $7,787 | $627,000 | $200,400 | $426,600 |
| 2023 | $7,481 | $550,100 | $180,300 | $369,800 |
| 2022 | $7,253 | $489,100 | $170,300 | $318,800 |
| 2021 | $7,038 | $479,100 | $160,300 | $318,800 |
| 2020 | $6,789 | $471,100 | $152,300 | $318,800 |
| 2019 | $6,561 | $461,100 | $142,300 | $318,800 |
| 2018 | $6,328 | $424,700 | $134,300 | $290,400 |
| 2017 | $6,144 | $408,800 | $128,300 | $280,500 |
| 2016 | $6,064 | $404,800 | $124,300 | $280,500 |
| 2015 | $5,927 | $388,900 | $128,400 | $260,500 |
Source: Public Records
Map
Nearby Homes
- 53 Queens Cir
- 935 King St
- 30 Edward Rd
- 68 Michael Rd
- 21 Sully Rd
- 224 Whippoorwill Dr
- 35 Spruce St
- 173 Titicut Rd
- 30 Spruce St
- 678 Pine St
- 698 Pine St
- 858 Pine St Unit Model
- 26 Nottingham Dr
- 40 Country Club Dr
- 68 Beech St
- 175 Leonard St Unit 2
- Off Vernon St
- 84 Diniz Dr
- 22 Highland Rd Unit 29
- 345 Cross St
Your Personal Tour Guide
Ask me questions while you tour the home.