Estimated Value: $333,226 - $513,000
3
Beds
2
Baths
2,507
Sq Ft
$160/Sq Ft
Est. Value
About This Home
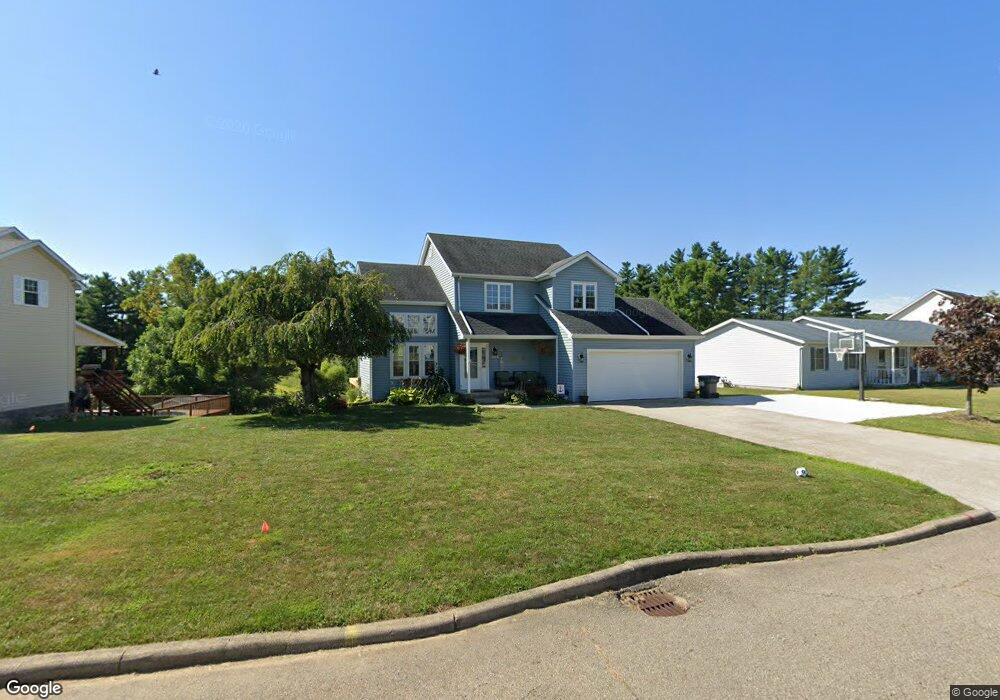
This home is located at 340 Mae St, Logan, OH 43138 and is currently estimated at $401,557, approximately $160 per square foot. 340 Mae St is a home located in Hocking County with nearby schools including Central Elementary School, Logan Christian School, and St. John the Evangelist School.
Ownership History
Date
Name
Owned For
Owner Type
Purchase Details
Closed on
Apr 30, 2013
Sold by
Lutz Roger F
Bought by
Mahaffey Matthew R and Mahaffey Melissa N
Current Estimated Value
Home Financials for this Owner
Home Financials are based on the most recent Mortgage that was taken out on this home.
Original Mortgage
$143,355
Outstanding Balance
$100,526
Interest Rate
3.25%
Mortgage Type
FHA
Estimated Equity
$301,031
Create a Home Valuation Report for This Property
The Home Valuation Report is an in-depth analysis detailing your home's value as well as a comparison with similar homes in the area
Home Values in the Area
Average Home Value in this Area
Purchase History
| Date | Buyer | Sale Price | Title Company |
|---|---|---|---|
| Mahaffey Matthew R | $146,000 | None Available |
Source: Public Records
Mortgage History
| Date | Status | Borrower | Loan Amount |
|---|---|---|---|
| Open | Mahaffey Matthew R | $143,355 |
Source: Public Records
Tax History Compared to Growth
Tax History
| Year | Tax Paid | Tax Assessment Tax Assessment Total Assessment is a certain percentage of the fair market value that is determined by local assessors to be the total taxable value of land and additions on the property. | Land | Improvement |
|---|---|---|---|---|
| 2024 | $3,281 | $83,440 | $21,830 | $61,610 |
| 2023 | $3,281 | $83,440 | $21,830 | $61,610 |
| 2022 | $3,287 | $83,440 | $21,830 | $61,610 |
| 2021 | $2,552 | $60,030 | $17,280 | $42,750 |
| 2020 | $2,554 | $60,030 | $17,280 | $42,750 |
| 2019 | $2,554 | $60,030 | $17,280 | $42,750 |
| 2018 | $2,407 | $57,580 | $14,830 | $42,750 |
| 2017 | $2,266 | $57,580 | $14,830 | $42,750 |
| 2016 | $2,250 | $57,580 | $14,830 | $42,750 |
| 2015 | $2,044 | $50,400 | $10,870 | $39,530 |
| 2014 | $2,044 | $50,400 | $10,870 | $39,530 |
| 2013 | $2,053 | $50,400 | $10,870 | $39,530 |
Source: Public Records
Map
Nearby Homes
- 849 Mohican Ave
- 875 Walhonding Ave
- 743 Summit Dr
- 32366 Lilac Ln
- 0 Lilac Ln Unit Lot 73
- 32268 Cedar Ln
- 28583 Hawthorne Way
- 67 W Front St
- State Route 328
- 226 W Front St
- 90 S Culver St
- 600 E 2nd St
- 385 W Main St
- 680 E Hunter St
- 165 N Homer Ave
- 1300 Dannie Dr
- 171 Warner Ave
- 345 Short St
- 331 Short St
- 260 Angle W Ave