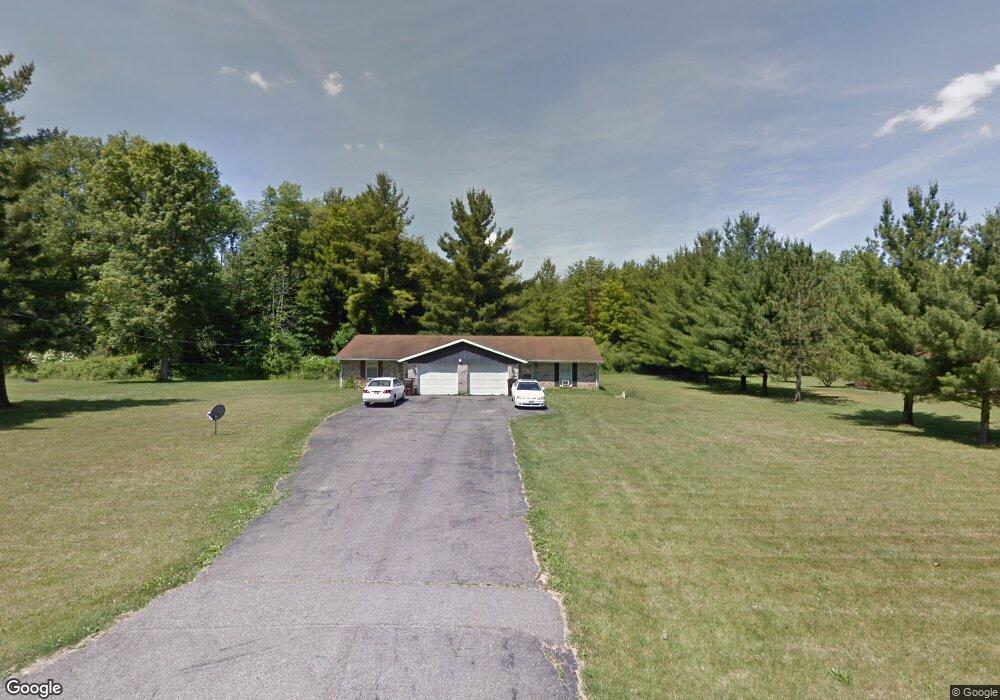
340 Marcus St Mansfield, OH 44903
Estimated Value: $150,000 - $218,000
4
Beds
2
Baths
1,780
Sq Ft
$108/Sq Ft
Est. Value
About This Home
This home is located at 340 Marcus St, Mansfield, OH 44903 and is currently estimated at $192,484, approximately $108 per square foot. 340 Marcus St is a home with nearby schools including Stingel Elementary School, Ontario Middle School, and Ontario High School.
Ownership History
Date
Name
Owned For
Owner Type
Purchase Details
Closed on
Oct 12, 2015
Sold by
Estate Of Auguste L Peay
Bought by
Rini Sandra L and Peay Family Revocable Living Trust
Current Estimated Value
Purchase Details
Closed on
Aug 15, 2008
Sold by
Peay Elbert O and Peay Auguste L
Bought by
Peay Elbert O and Peay Auguste L
Purchase Details
Closed on
Aug 25, 1992
Sold by
Peay Elbert O
Bought by
Peay Elbert O
Create a Home Valuation Report for This Property
The Home Valuation Report is an in-depth analysis detailing your home's value as well as a comparison with similar homes in the area
Home Values in the Area
Average Home Value in this Area
Purchase History
| Date | Buyer | Sale Price | Title Company |
|---|---|---|---|
| Rini Sandra L | -- | None Available | |
| Peay Elbert O | -- | Attorney | |
| Peay Elbert O | -- | -- |
Source: Public Records
Tax History
| Year | Tax Paid | Tax Assessment Tax Assessment Total Assessment is a certain percentage of the fair market value that is determined by local assessors to be the total taxable value of land and additions on the property. | Land | Improvement |
|---|---|---|---|---|
| 2024 | $2,370 | $46,540 | $9,030 | $37,510 |
| 2023 | $2,371 | $46,540 | $9,030 | $37,510 |
| 2022 | $2,222 | $37,560 | $8,210 | $29,350 |
| 2021 | $2,226 | $37,560 | $8,210 | $29,350 |
| 2020 | $2,377 | $37,560 | $8,210 | $29,350 |
| 2019 | $2,225 | $31,820 | $6,950 | $24,870 |
| 2018 | $1,897 | $31,820 | $6,950 | $24,870 |
| 2017 | $1,878 | $31,820 | $6,950 | $24,870 |
| 2016 | $1,889 | $32,000 | $6,740 | $25,260 |
| 2015 | $1,889 | $32,000 | $6,740 | $25,260 |
| 2014 | $1,891 | $32,000 | $6,740 | $25,260 |
| 2012 | $1,776 | $32,990 | $6,950 | $26,040 |
Source: Public Records
Map
Nearby Homes
- 2735 Millsboro Rd E
- 3320 Oakstone Dr
- 3308 Park Ave W
- 3516 Muirfield Dr
- 3516 Muirfield
- 159 Clare Rd
- 15 Lexington Ontario Rd
- 3560 Park Ave W
- 205 Sloboda Ave
- 50 Clare Rd
- 0 Rudy Rd
- 3670 Pearl St
- 0 Millsboro Rd Unit 9067349
- 0 Millsboro Rd Unit 9066844
- 2990 Hemlock Place
- 3880 Horizon Dr
- 2583 Deerfield Ln
- 855 Bowers Rd
- 1400 Charolais Dr
- 683 Yeager Dr
- 350 Marcus St Unit 352
- 330 Marcus St Unit 332
- 355 Marcus St
- 345 Marcus St
- 335 Marcus St
- 320 Marcus St
- 3070 Blair Ave
- 385 Marcus St
- 325 Marcus St
- 3050 Blair Ave
- 3060 Blair Ave
- 3065 Blair Ave
- 3045 Blair Ave
- 3075 Blair Ave
- 2964 Millsboro Rd E
- 438 Summit Dr Unit 440
- 450 Summit Dr
- 3016 Millsboro Rd E
- 2984 Millsboro Rd E
- 300 Deer Creek Ln
Your Personal Tour Guide
Ask me questions while you tour the home.