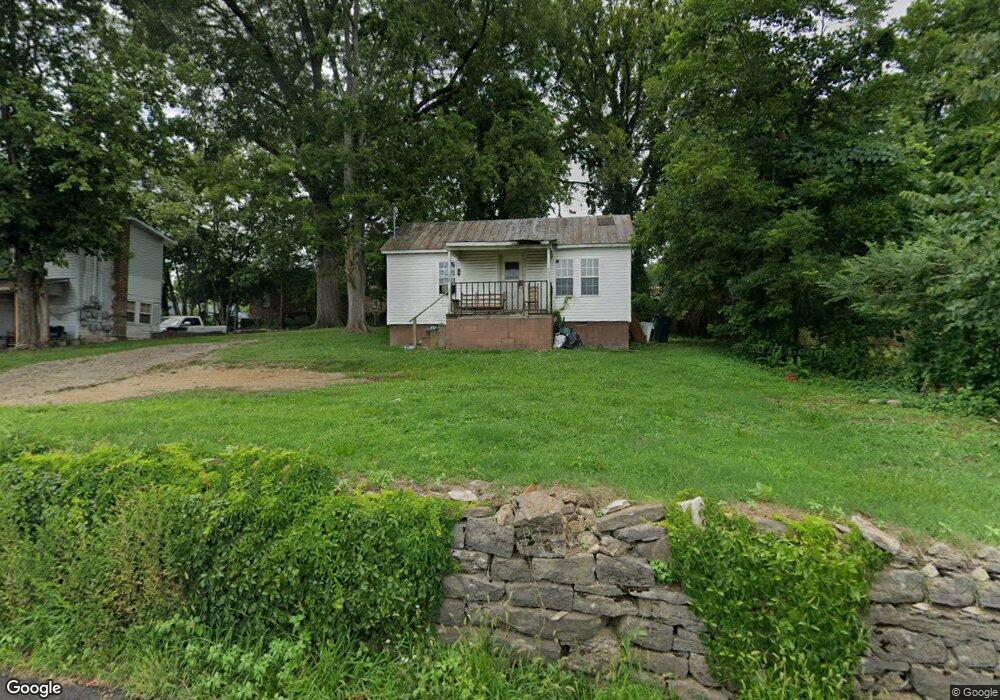
340 N 3rd St Pulaski, TN 38478
Estimated Value: $60,510 - $133,000
--
Bed
1
Bath
672
Sq Ft
$138/Sq Ft
Est. Value
About This Home
This home is located at 340 N 3rd St, Pulaski, TN 38478 and is currently estimated at $92,878, approximately $138 per square foot. 340 N 3rd St is a home located in Giles County with nearby schools including Pulaski Elementary School, Southside Elementary School, and Bridgeforth Middle School.
Ownership History
Date
Name
Owned For
Owner Type
Purchase Details
Closed on
Apr 14, 2009
Sold by
Sigmon Merry B
Bought by
Bates Forrest
Current Estimated Value
Purchase Details
Closed on
Sep 7, 2004
Sold by
Swartz & Brough Inc
Bought by
Jackson Eric
Home Financials for this Owner
Home Financials are based on the most recent Mortgage that was taken out on this home.
Original Mortgage
$17,000
Interest Rate
6.01%
Purchase Details
Closed on
Jun 18, 2004
Sold by
Ib Property Holding Llc
Bought by
Swartz & Brough Inc
Purchase Details
Closed on
Feb 6, 2004
Bought by
Ib Property Holdings Llc
Purchase Details
Closed on
Feb 11, 2002
Sold by
Swartz & Brough Inc
Bought by
Bryant James
Home Financials for this Owner
Home Financials are based on the most recent Mortgage that was taken out on this home.
Original Mortgage
$17,550
Interest Rate
7.02%
Purchase Details
Closed on
Nov 2, 2001
Sold by
Holman John E
Bought by
Swartz And Brough Inc
Purchase Details
Closed on
Apr 3, 1997
Sold by
Hunt James
Bought by
Holman John E
Purchase Details
Closed on
May 3, 1996
Sold by
Martin Jeffrey
Bought by
Hunt James
Purchase Details
Closed on
Oct 26, 1981
Bought by
Martin Jeffrey and Martin Treva
Create a Home Valuation Report for This Property
The Home Valuation Report is an in-depth analysis detailing your home's value as well as a comparison with similar homes in the area
Home Values in the Area
Average Home Value in this Area
Purchase History
| Date | Buyer | Sale Price | Title Company |
|---|---|---|---|
| Bates Forrest | $3,000 | -- | |
| Jackson Eric | $18,000 | -- | |
| Swartz & Brough Inc | $6,000 | -- | |
| Ib Property Holdings Llc | $12,900 | -- | |
| Bryant James | $19,500 | -- | |
| Swartz And Brough Inc | $11,000 | -- | |
| Holman John E | -- | -- | |
| Hunt James | $20,000 | -- | |
| Martin Jeffrey | -- | -- |
Source: Public Records
Mortgage History
| Date | Status | Borrower | Loan Amount |
|---|---|---|---|
| Previous Owner | Martin Jeffrey | $17,000 | |
| Previous Owner | Martin Jeffrey | $17,550 |
Source: Public Records
Tax History Compared to Growth
Tax History
| Year | Tax Paid | Tax Assessment Tax Assessment Total Assessment is a certain percentage of the fair market value that is determined by local assessors to be the total taxable value of land and additions on the property. | Land | Improvement |
|---|---|---|---|---|
| 2024 | $290 | $12,050 | $2,325 | $9,725 |
| 2023 | $290 | $12,050 | $2,325 | $9,725 |
| 2022 | $290 | $12,050 | $2,325 | $9,725 |
| 2021 | $71 | $2,075 | $1,250 | $825 |
| 2020 | $71 | $2,075 | $1,250 | $825 |
| 2019 | $59 | $2,075 | $1,250 | $825 |
| 2018 | $71 | $2,075 | $1,250 | $825 |
| 2017 | $71 | $2,075 | $1,250 | $825 |
| 2016 | $72 | $2,025 | $1,250 | $775 |
| 2015 | $68 | $2,025 | $1,250 | $775 |
| 2014 | $67 | $2,019 | $0 | $0 |
Source: Public Records
Map
Nearby Homes
- 321 W Washington St
- 318 W Jefferson St
- 0 Sumpter St
- 219 W Flower St
- 124 Chestnut St
- 420 Fort Hill Dr
- 118 S Rhodes St
- 418 Jones St
- 720 W Madison St
- 210 S 6th St
- 320 Park St
- 140 Phillips St
- 123 S Sam Davis Ave
- 808 N 1st St
- 439 E Madison St
- 403 Victoria St
- 528 Maple St
- 602 S 1st St
- 0 Marietta St
- 958 Dollar Hollow Rd
- 318 W Washington St Unit 320
- 320 W Washington St
- 315 Mcgrew St
- 225 W Woodring St
- 305 W Woodring St
- 302 Alexander St
- 306 Alexander St
- 219 W Woodring St
- 322 Mcgrew St
- 224 N 3rd St
- 314 W Woodring St
- 222 W Woodring St
- 317 W Washington St
- 308 W Woodring St
- 308 W Woodring St
- 323 W Woodring St
- 327 Alexander St
- 402 N 3rd St
- 311 Alexander St Unit 313
- 219 N 3rd St