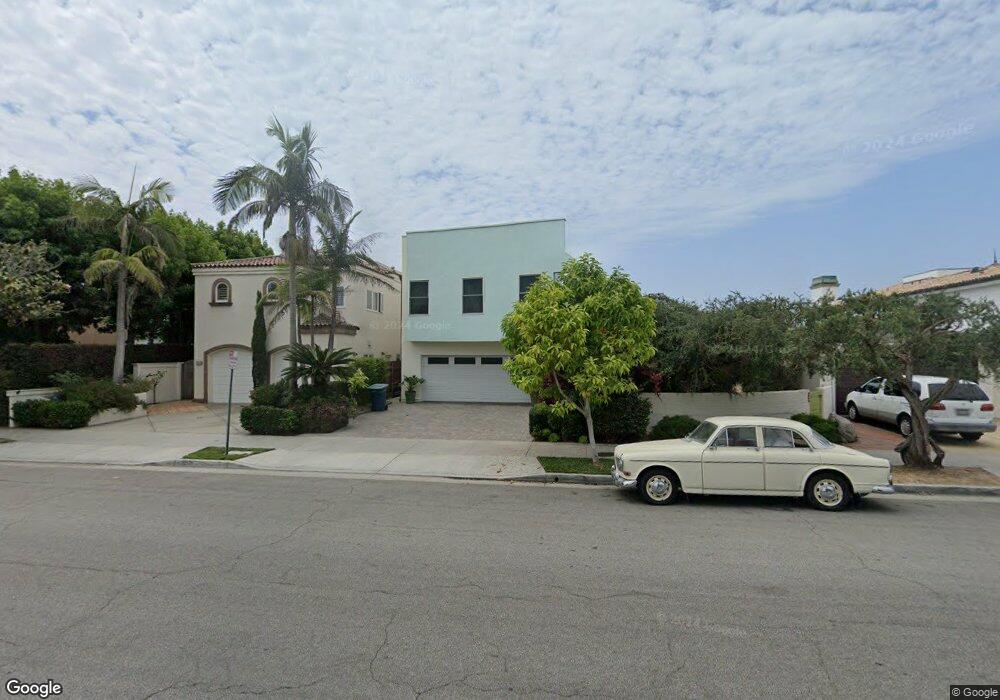
340 Ocean Ave Seal Beach, CA 90740
Estimated Value: $2,962,000 - $4,454,000
5
Beds
7
Baths
3,608
Sq Ft
$1,034/Sq Ft
Est. Value
About This Home
This home is located at 340 Ocean Ave, Seal Beach, CA 90740 and is currently estimated at $3,732,453, approximately $1,034 per square foot. 340 Ocean Ave is a home located in Orange County with nearby schools including J. H. Mcgaugh Elementary School, Jack L. Weaver Elementary School, and Sharon Christa Mcauliffe Middle School.
Ownership History
Date
Name
Owned For
Owner Type
Purchase Details
Closed on
Jan 25, 2021
Sold by
Sandra Bryaton Nair Qualified Personal R
Bought by
Nair Maya A and Nair Amar S
Current Estimated Value
Purchase Details
Closed on
Dec 17, 2012
Sold by
Nair Sandra Brayton
Bought by
The Sandra Brayton Nair Qualified Person
Purchase Details
Closed on
Mar 23, 1994
Sold by
Nair Mohan S
Bought by
Nair Sandra Brayton
Purchase Details
Closed on
Feb 28, 1993
Sold by
Nair Mohan S
Bought by
Nair Sandra Brayton
Create a Home Valuation Report for This Property
The Home Valuation Report is an in-depth analysis detailing your home's value as well as a comparison with similar homes in the area
Home Values in the Area
Average Home Value in this Area
Purchase History
| Date | Buyer | Sale Price | Title Company |
|---|---|---|---|
| Nair Maya A | -- | None Available | |
| The Sandra Brayton Nair Qualified Person | -- | None Available | |
| Nair Sandra Brayton | -- | -- | |
| Nair Sandra Brayton | -- | -- | |
| Nair Sandra Brayton | -- | -- |
Source: Public Records
Tax History Compared to Growth
Tax History
| Year | Tax Paid | Tax Assessment Tax Assessment Total Assessment is a certain percentage of the fair market value that is determined by local assessors to be the total taxable value of land and additions on the property. | Land | Improvement |
|---|---|---|---|---|
| 2025 | $16,533 | $1,470,998 | $940,203 | $530,795 |
| 2024 | $16,533 | $1,442,155 | $921,767 | $520,388 |
| 2023 | $16,169 | $1,413,878 | $903,693 | $510,185 |
| 2022 | $16,009 | $1,386,155 | $885,973 | $500,182 |
| 2021 | $15,652 | $1,358,976 | $868,601 | $490,375 |
| 2020 | $15,683 | $1,345,042 | $859,695 | $485,347 |
| 2019 | $15,195 | $1,318,669 | $842,838 | $475,831 |
| 2018 | $14,492 | $1,292,813 | $826,312 | $466,501 |
| 2017 | $14,187 | $1,267,464 | $810,110 | $457,354 |
| 2016 | $13,918 | $1,242,612 | $794,225 | $448,387 |
| 2015 | $13,747 | $1,223,947 | $782,295 | $441,652 |
| 2014 | $13,415 | $1,199,972 | $766,971 | $433,001 |
Source: Public Records
Map
Nearby Homes