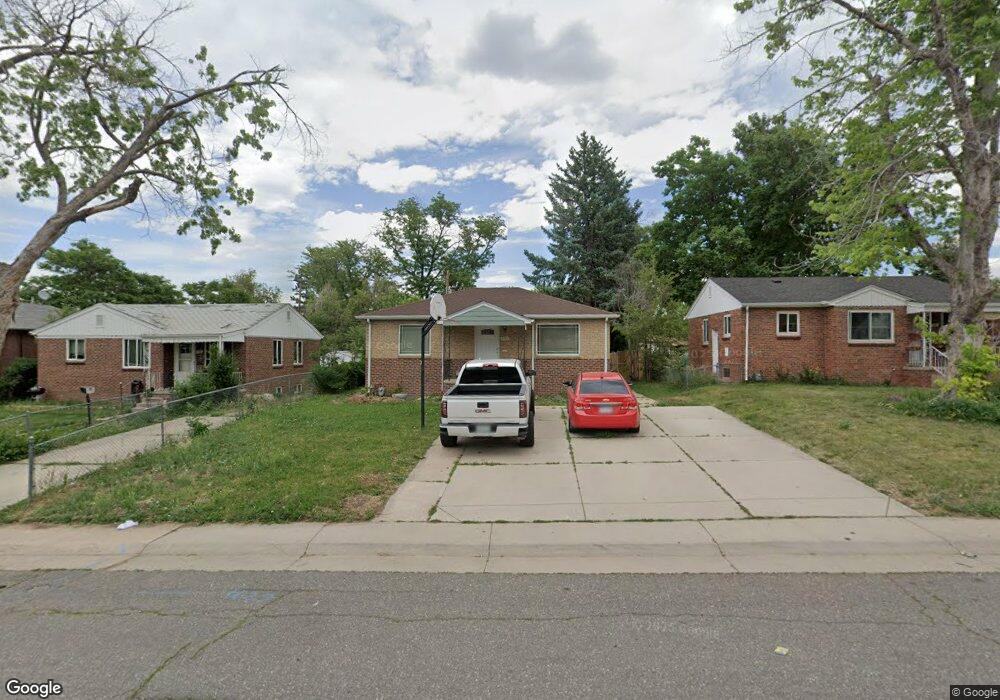
340 S Canosa Ct Denver, CO 80219
Athmar Park NeighborhoodEstimated Value: $504,000 - $560,278
4
Beds
2
Baths
1,608
Sq Ft
$329/Sq Ft
Est. Value
About This Home
This home is located at 340 S Canosa Ct, Denver, CO 80219 and is currently estimated at $529,070, approximately $329 per square foot. 340 S Canosa Ct is a home located in Denver County with nearby schools including Valverde Elementary School, Kepner Beacon Middle School, and West High School.
Ownership History
Date
Name
Owned For
Owner Type
Purchase Details
Closed on
Jul 14, 2015
Sold by
Madrigal Mario and Avila Maria L
Bought by
Pearson James
Current Estimated Value
Home Financials for this Owner
Home Financials are based on the most recent Mortgage that was taken out on this home.
Original Mortgage
$209,000
Outstanding Balance
$163,193
Interest Rate
3.9%
Mortgage Type
New Conventional
Estimated Equity
$365,877
Purchase Details
Closed on
Jun 13, 2012
Sold by
Ranfranz Inc
Bought by
Madrigal Mario and Avila Maria I
Home Financials for this Owner
Home Financials are based on the most recent Mortgage that was taken out on this home.
Original Mortgage
$162,011
Interest Rate
3.86%
Mortgage Type
FHA
Purchase Details
Closed on
Nov 29, 2011
Sold by
Fannie Mae
Bought by
Ranfranz Inc
Purchase Details
Closed on
Aug 19, 2011
Sold by
Mcnelis Helen E
Bought by
Federal National Mortgage Association
Purchase Details
Closed on
Mar 2, 1999
Sold by
Mcnelis Bernard T and Mcnelis Helen E
Bought by
Mcnelis Bernard T and Mcnelis Helen E
Home Financials for this Owner
Home Financials are based on the most recent Mortgage that was taken out on this home.
Original Mortgage
$100,000
Interest Rate
6.73%
Create a Home Valuation Report for This Property
The Home Valuation Report is an in-depth analysis detailing your home's value as well as a comparison with similar homes in the area
Home Values in the Area
Average Home Value in this Area
Purchase History
| Date | Buyer | Sale Price | Title Company |
|---|---|---|---|
| Pearson James | $261,300 | Chicago Title Co | |
| Madrigal Mario | $165,000 | Fidelity National Title Insu | |
| Ranfranz Inc | $95,000 | Cat | |
| Federal National Mortgage Association | -- | None Available | |
| Mcnelis Bernard T | -- | -- |
Source: Public Records
Mortgage History
| Date | Status | Borrower | Loan Amount |
|---|---|---|---|
| Open | Pearson James | $209,000 | |
| Previous Owner | Madrigal Mario | $162,011 | |
| Previous Owner | Mcnelis Bernard T | $100,000 | |
| Closed | Mcnelis Bernard T | $25,000 |
Source: Public Records
Tax History Compared to Growth
Tax History
| Year | Tax Paid | Tax Assessment Tax Assessment Total Assessment is a certain percentage of the fair market value that is determined by local assessors to be the total taxable value of land and additions on the property. | Land | Improvement |
|---|---|---|---|---|
| 2024 | $2,800 | $35,350 | $9,920 | $25,430 |
| 2023 | $2,739 | $35,350 | $9,920 | $25,430 |
| 2022 | $2,105 | $26,470 | $14,110 | $12,360 |
| 2021 | $2,031 | $27,220 | $14,510 | $12,710 |
| 2020 | $2,043 | $27,530 | $8,040 | $19,490 |
| 2019 | $1,985 | $27,530 | $8,040 | $19,490 |
| 2018 | $1,762 | $22,780 | $6,750 | $16,030 |
| 2017 | $1,757 | $22,780 | $6,750 | $16,030 |
| 2016 | $1,341 | $16,450 | $4,975 | $11,475 |
| 2015 | $1,285 | $16,450 | $4,975 | $11,475 |
| 2014 | $1,008 | $12,140 | $2,484 | $9,656 |
Source: Public Records
Map
Nearby Homes
- 360 S Bryant St
- 326 S Alcott St
- 222 S Canosa Ct
- 480 S Canosa Ct
- 527 S Bryant St
- 118 S Dale Ct
- 175 S Eliot St
- 2251 W Custer Place
- 601 S Dale Ct
- 3092 W Alaska Place
- 2120 W Custer Place
- 695 S Bryant St
- 2823 W Archer Place
- 2772 W Ellsworth Ave
- 2841 W Archer Place
- 2843 W Archer Place
- 3073 W Center Ave Unit A
- 3073 W Center Ave Unit C
- 1557 W Dakota Ave
- 2141 W Gill Place
- 348 S Canosa Ct
- 332 S Canosa Ct
- 354 S Canosa Ct
- 320 S Canosa Ct
- 343 S Bryant St
- 333 S Canosa Ct
- 362 S Canosa Ct
- 339 S Bryant St Unit A
- 339 S Bryant St Unit A & B
- 341 S Bryant St
- 357 S Canosa Ct
- 325 S Bryant St
- 370 S Canosa Ct
- 363 S Bryant St
- 321 S Canosa Ct
- 369 S Canosa Ct
- 325 S Canosa Ct
- 369 S Bryant St
- 378 S Canosa Ct
- 375 S Canosa Ct