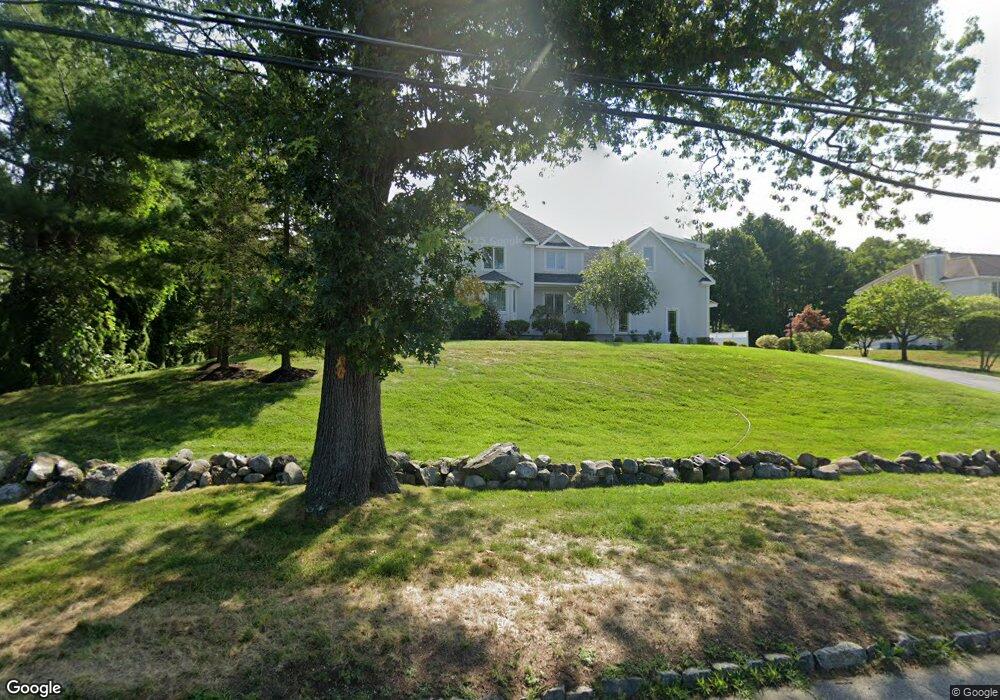
340 S Main St Andover, MA 01810
Phillips Academy NeighborhoodEstimated Value: $1,728,000 - $2,169,000
4
Beds
4
Baths
4,701
Sq Ft
$400/Sq Ft
Est. Value
About This Home
This home is located at 340 S Main St, Andover, MA 01810 and is currently estimated at $1,882,642, approximately $400 per square foot. 340 S Main St is a home located in Essex County with nearby schools including Bancroft Elementary School, Doherty Middle School, and Andover High School.
Ownership History
Date
Name
Owned For
Owner Type
Purchase Details
Closed on
Oct 4, 2010
Sold by
Bastable Colin and Bastable Bianca L
Bought by
Bradley Kenneth A and Lee Waioeng
Current Estimated Value
Purchase Details
Closed on
Aug 25, 2006
Sold by
Washington Street Rt and Kalogianis
Bought by
Olympic Construction I
Home Financials for this Owner
Home Financials are based on the most recent Mortgage that was taken out on this home.
Original Mortgage
$122,000
Interest Rate
6.83%
Mortgage Type
Purchase Money Mortgage
Create a Home Valuation Report for This Property
The Home Valuation Report is an in-depth analysis detailing your home's value as well as a comparison with similar homes in the area
Home Values in the Area
Average Home Value in this Area
Purchase History
| Date | Buyer | Sale Price | Title Company |
|---|---|---|---|
| Bradley Kenneth A | $1,020,000 | -- | |
| Bradley Kenneth A | $1,020,000 | -- | |
| Olympic Construction I | $450,000 | -- | |
| Bastable Colin | $1,220,000 | -- | |
| Bastable Colin | $1,220,000 | -- | |
| Olympic Construction I | $450,000 | -- |
Source: Public Records
Mortgage History
| Date | Status | Borrower | Loan Amount |
|---|---|---|---|
| Open | Bastable Colin | $680,000 | |
| Closed | Bastable Colin | $700,000 | |
| Previous Owner | Olympic Construction I | $122,000 | |
| Previous Owner | Bastable Colin | $976,000 |
Source: Public Records
Tax History Compared to Growth
Tax History
| Year | Tax Paid | Tax Assessment Tax Assessment Total Assessment is a certain percentage of the fair market value that is determined by local assessors to be the total taxable value of land and additions on the property. | Land | Improvement |
|---|---|---|---|---|
| 2024 | $18,998 | $1,475,000 | $409,900 | $1,065,100 |
| 2023 | $18,448 | $1,350,500 | $379,500 | $971,000 |
| 2022 | $17,679 | $1,210,900 | $321,500 | $889,400 |
| 2021 | $17,065 | $1,116,100 | $292,200 | $823,900 |
| 2020 | $16,454 | $1,096,200 | $285,100 | $811,100 |
| 2019 | $15,928 | $1,043,100 | $276,800 | $766,300 |
| 2018 | $15,208 | $972,400 | $261,000 | $711,400 |
| 2017 | $14,652 | $965,200 | $255,900 | $709,300 |
| 2016 | $14,359 | $968,900 | $255,900 | $713,000 |
| 2015 | $13,832 | $924,000 | $246,000 | $678,000 |
Source: Public Records
Map
Nearby Homes